|
This page may contain links that result in small commissions to keep this free site up and running.

Welcome Guest! Registering and/or logging in will remove the anchor (bottom) ads and the security checks. It's Free!
To participate in the forum you must log in or register. | Author |
 Replies: 5,661 / Views: 465,831 Replies: 5,661 / Views: 465,831 |
|
|
|
Pillar of the Community
 United States
3789 Posts |
ok folks lets run this down. Last week it appeared as if gold and silver were ready to pick up their downtrend. Then we received a bounce, which you might recall, coincided with testimony from Yellen. The news event clearly was a short squeeze moment which quickly evaporated going into this week. Lets get into the charts. As always, I am keeping these super super super simple and clean as possible. What I hope everyone can visualize and understand is that ANY asset, such as stocks, bonds, currencies, and commodities, such as gold and silver, ALL of them are nothing but a repetition of numbers, trends and momentum. The numbers are expressed by PRICE. Remember that PRICE TRUMPS EVERYTHING, so no matter how you may "feel" about a given asset, if its price is going contrary to how you feel, you are wrong. Finally, as we look at these charts, I want to emphasis this also: charts only tell us the PAST. They give us no clue about the future, only a certain set of scenarios which play out on their own, we simply observe and follow what happens as it plays out in real time. 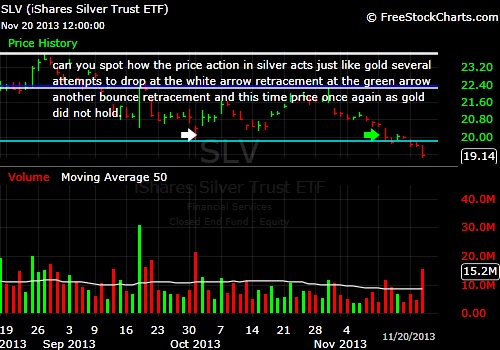 Ok this is how it stands. Look at the white arrow, our proxy for silver, SLV stopped and bounced at that price on 10/1. Almost a month later on 11/12 SLV again came into the same area and bounced. It chopped and bounced and started the week moving lower. Notice that its been putting in a series of lower highs and lower lows since last Friday, that was a major clue in front of what happened today. Hence, that is a perfect example why despite everyday price action could be called boring, it all comes together to paint a bigger picture. Today saw SLV breaking that price point finally and slicing lower. BTW, all charts for silver, whether they be physical spot or futures contracts will match up with this same pattern we are seeing in our proxy SLV. The same can be said for GLD. Now the next chart goes back 6 months, and I am using that one to give everyone an idea of whats below us. 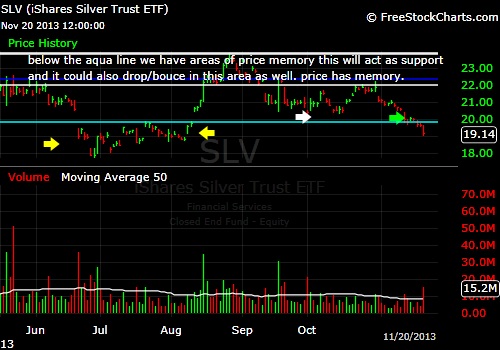 Take a look at the aqua line and below it. Between the two yellow arrows we have the yearly lows. Here is where we will get support of some sort. Do we chop, bounce or just drill straight into the yearly lows? I think the higher probability is first we race to the yearly low to re-test it and bounce. The reason I say that is because for many months now this has been the pattern exhibited by the metals and other assets. So here is what to look for in Silver- a. bounce and reversal from right where price is as of today b. a move lower with lots of chop. c. heavy selling runs the price all the way into the yearly low for silver and it proceeds to blast past it and makes a fresh yearly low. anything is possible so keep an open mind, remembering that we are in a very strong downtrend. On to gold, with our GLD proxy 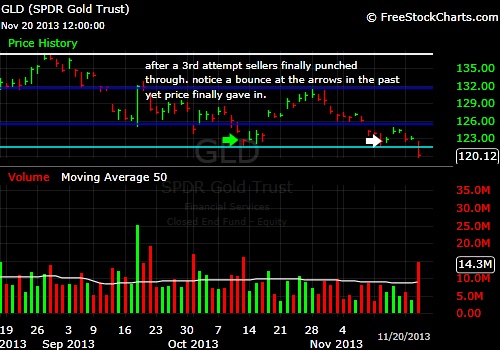 Same exact price action. Look at the white arrow. Last week we hit an area of support that held before on 10/11. On the third attempt it also sliced through. same pattern. Notice also the blue lines. Within those blue lines we had a trading range, a lot of chop. Eventually, as I had been saying, the range would be broken. If you look back at the SLV charts, you can also see the range that silver was in. Here is another chart, going back six months to give a view of what we have below the aqua line. 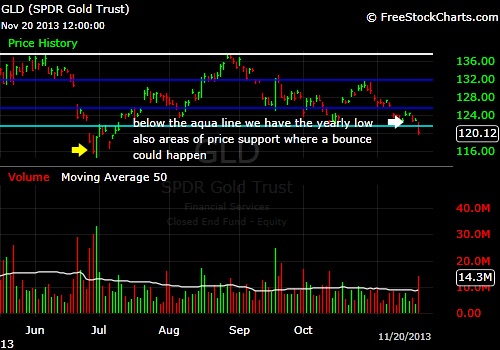 Once again we see areas where GLD bounced from, this areas will be support going forward. So, as I stated earlier with SLV, these areas of price will be support. Again, expect some chop, bounces, churn, etc. As I stated there can be several scenarios that will play out. Again, I lean on a re-test of the yearly lows eventually. So the question everyone has is, how low will silver and gold get? At this momement we dont know exactly, at this stage lower prices will happen. How low? We'll have to stay tuned. At this stage tho we lose 20 I think we go by levels. On the far end 20-15. Shorter term I think its possible we see below 20 and at least a rest of the yearly lows at 18.22. Again, it will be best to take everything level by level. If/when we hit the yearly lows we can start to look at price levels that could give support. With gold, we lose 1250 and 1200 would be on tap, and then a restest of yearly lows at 1179. If yearly lows break then I think we first look for a test of 1,000. After that, then, once again, we can go level by level below 1000. I hope this all helps in understanding whats going on, I hope you guys can see that all this is happening in a trend, in this case a downtrend. Within the trend, there are counter trend moves, which we have seen many times this year in gold and silver. Yet, a test of the yearly lows will strengthen this trend until it finally finds an area of support and stops making yearly lows. Perhaps we are close....and perhaps not. So it is key to keep an open mind. Don't attempt to front run gold and silver and assume that its going back to historical lows and conversely dont feel confident that after some selling and a strong bounce that the worst and over and that now, finally, the PMs are ready to run higher. This is a common mistake that happens to everyone, even traders. The best thing is to use PRICE as your guide along with the element of time. Time will let things work out and we do have a lot of time on our side. Hope the charts help, if I missed something or something doesn't make sense let me know so I can clear it up or help you understand better. |
|
Pillar of the Community
United States
3789 Posts |
As far as Bitcoin, well,,, if you speculate on it, be ready to move in seconds. Its really wild lol
|
|
Pillar of the Community
United States
2764 Posts |
Thanks yup for the detail charts and explanation.
|
|
Pillar of the Community
United States
3789 Posts |
Ok, looks like we are getting the bounce scenario, remember theres plenty of support down below here.
This has been a constant in gold and silver, drops, chops, bounces, ranges, squeezes etc. Can you say broken asset lol
continue to remain patient and watch price
|
|
Pillar of the Community
United States
3789 Posts |
Interesting tussle here today. Almost as if silver wants to lead gold lower here. As I had mentioned, there is support down below these prices so we should be prepared for anything, and seeing its a Friday, I would be surprised we see much of anything, tho today could set us up for lower prices come next week depending on the close. As always, keep an open mind and realize where price stands. I certainly wouldn't be making purchases in anything gold and silver over the weekend. Probably best to wait out the week at least, not even nibble, tho if you are a Somalia elephant lover as myself, that might be hard but its worth the extra wait and patience.  I;ll have a wrap up over the weekend and later today. |
|
Pillar of the Community
United States
3789 Posts |
heads up,,, big week here for both silver and gold. If we dont see at least a re-test of yearly lows this week I would be surprised.
More later should have a late night up date here.
|
|
Pillar of the Community
United States
2764 Posts |
We have a bounce today..... If it hit yearly low then I'll be in for some 5oz ATB bullions..... Make it happen yup! |
|
Valued Member
United States
493 Posts |
We are going to bounce around allot, and for a long time. We have a great deal of investment into metal commodities over the last few years, which is not letting up. It's going to take a recession to knock silver down, and even then, investment dollars (which are entirely two plentiful these days), will pour into it, enough so to absorb supply, happened back in 2009, it will happen again. The cat has been let out of the bag with silver, and it will not be under valued this time around.
|
|
Pillar of the Community
United States
3789 Posts |
Hey guys, sorry been busy and backed up here.
We have, as I had mentioned, support down here with both gold and silver. However, we are seeing that we continue, day by day, to get closer and closer to those yearly lows.
Since April all we had done is trade lower, consolidate, move lower, consolidate, move lower. This is a powerful downtrend and there is just not enough buyers of silver and gold to support prices. There is NO fund or institutional support to raise prices.
Whats key is-
what happens at the test of the yearly lows. Either we slice and rip below it or it bounces off the yearly lows. Anything is possible. However, keep in mind, just the mere fact that we are touching yearly low is enough to tell one that gold and silver are being dumped.
Nothing is supporting PMs, no QE, no low interest rates, nor a weaker dollar, etc. Furthermore, there is SO MUCH overhead supply in relation to gold and silver in terms of price that you should not expect prices to revert back to their highs. It just isn't going to happen overnight and it will take a long time to overcome all the selling in price that gold and silver have seen.
|
|
Pillar of the Community
United States
3789 Posts |
first my apologies for the delay in updating here tonight gives me a few minutes to update later on this evening I will sneak in an update.
Price action this week? TO me I see this range and chop, on the lower end. Heck I would not be surprised to see a pop from here, its happened before.
anyways i;ll get some nice charts up.
final quick thought- for investment, wait before buying. If just collecting here and there and its bullion related, only nibble. Backing the truck up? no, not at all.
more later
|
|
Pillar of the Community
Canada
746 Posts |
And down she goes; where she stops nobody knows!  |
|
Pillar of the Community
United States
3789 Posts |
update coming with charts in a few. we have a lot to look at.
be back in a few
|
|
Pillar of the Community
United States
3789 Posts |
Ok lets get into our proxies first as I want to illustrate how price moves. Then later we'll get into levels to be looking at and scenarios. For months gold and silver have been grinding in ranges with a lot of chop and retracements in price. We have seen several bounces happen and then seen them cut down. Why? Simple, this is all about price leading the direction of the move and through time digesting it. With a strong downtrend in place, there never was any doubt that despite any sort of retracement in price, that there was no serious buying to push prices out of their downtrend. Lets first look at GLD our proxy and see how price has shown us this move lower was coming. GLD- 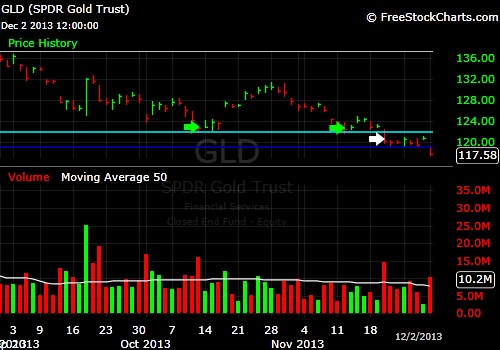 I first want to again draw your attention to the green arrows. Here price came into a previous area of support and bounced. But also notice that on the third attempt of coming into this area of support, price crashed through and proceeded to go lower, look at the white arrow. What followed that move? Notice the price action between the aqua line and dark blue line. Notice how gold continued to consolidate with a narrow range for a week. What happened today? Once again, gold broke lower out of the range, in fact it ended the day at the lower end of its range. It is easy to see the countless clues being dropped that gold has been going lower and wants to go lower, the downtrend is strong and as such, price is following the path of least resistance, which is clearly down. SLV 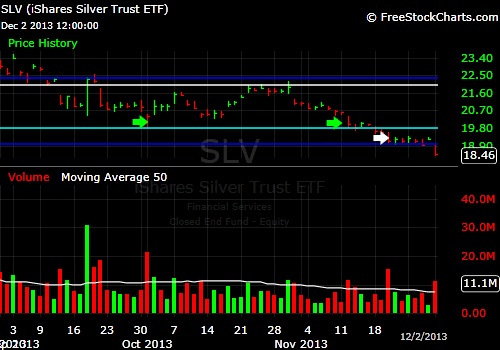 Same EXACT price pattern. Notice the green areas. Again. price goes to an area of support from the past. Two attempts and a bounce, yet, as with gold, the bounce on the second time was weak. A third probe of that aqua line and it was enough to crash past it. Now look to the white arrow. Once again, just as with gold, silver has consolidated for a week. Today showed us the direction silver wants and wanted to go, lower. So there you have it. How low we go is what is on everyone's mind. First, I say, who cares! Let price take gold and silver where it wants too. It will sort everything out besides, calling exact gold and silver prices are for fools and gamblers. So rather than waste time in trying to call exact prices, we can get some sort of approximate areas of support and levels. We also have a good idea of where gold and silver want to go in the short term. For starters, I think its highly probable gold and silver will re-test their yearly lows. So we are looking for 18ish on silver and 1180ish on gold. Now, when an asset has a strong trend, momentum carries it farther in the direction it is going. In this case, its down. I repeat a lot that gold and silver are in a downtrend because many here seem to think that because gold and silver have bounced or retraced upwards, that means the downtrend is wrong. Clearly this is wrong thinking and the price action has shown that. So keeping in mind the strength of a trend, whether it be up or down dont be surprised that we could retest the lows and blow past them. Therefore, it is entirely possible we see new yearly lows for gold and silver. Does this mean it happens immediately? It could but then again keep in mind we do have some areas of resistance and support so we might once again see consolidation. Another scenario I am prepared for is to see gold and silver hit the yearly lows and bounce off of them. That is also possible. Perhaps we we grind a bit higher and go into yet another range. We can also look at levels. Many times, assets are attracted to even numbers or ranges. So with gold, being under 20 and with a retest of the previous lows, I could see a a range develop perhaps with 15 being at the lower end. With gold, I think we first go for a round 1,000 on the low end. But again, instead of guessing an exact, lets concentrate on levels as that will give us a better handle on how low. Finally I want to recap a few important things in terms of price action. I want to repeat these again because by repeating them you will not forget them and when you see them happen again, you will be able to have a good idea of whats going on- 1- Trends in either direction are strong, they dont change overnight. 2- We can judge how strong a trend is by the price action. Assets near yearly lows are being dumped by funds and instituions. Conversely, assets at yearly highs are being bought by funds and institutions. 3- Price NEVER EVER LIES. No matter what your opinion is of an asset, if it is acting contrary to what you think, you are in the wrong. In the example of gold and silver, there are those who have continued to insist that gold and silver are going higher or cant go lower. Every single sort of theory and supposed reason has been given for why gold and silver cant go lower: China and India are buying, QE will support gold and silver, "paper trading" distorts the market and other myths and misinformation. Again remember, PRICE never lies and is NEVER WRONG. You can have your opinion and believe it but you will never be able to go against the markets. 4- The day to day price movements of an asset help paint an overall picture. Don't be quick to brush off what happens each day and scoff at it. It is more than "up today, down tomorrow." Rather, periods of consoldiation in price happen in this time period, ranges and other important events are related to us in the form of price. This should be an interesting week so stay tuned and observe what happens. |
|
Pillar of the Community
United States
3789 Posts |
Just a quick update-
so today we see further follow through on silver and we have seen it in gold with a bit of a bounce. In any case, both have put in lower highs and lower lows today in the AM.
Again, what we are looking for is the eventual re-test of the yearly lows or we get some sort of range with consolidation before another move is made.
this is not the time to be buying anything as we are waiting on another move of importance in the PMs.
|
|
Pillar of the Community
United States
3789 Posts |
and... the chop and bounce show continues with gold and silver.
It would be interesting to see if we get a range bound market this week.
more later
|
| |
Replies: 5,661 / Views: 465,831 |
To participate in the forum you must log in or register.
Disclaimer: While a tremendous amount of effort goes into ensuring the accuracy of the information contained in this site, Coin Community assumes no liability for errors. Copyright 2005 - 2026 Coin Community Family- all rights reserved worldwide. Use of any images or content on this website without prior written permission of Coin Community or the original lender is strictly prohibited.
Contact Us | Advertise Here | Privacy Policy / Terms of Use
|
| Coin Community Forum |
© 2005 - 2026 Coin Community Forums |
| It took 0.83 seconds to rattle this change. |
 |
|
| |
| |






 First Page
 Previous Page


 Posted 11/21/2013 03:36 am


