Ok lets look at silver-
When I did my last update, it appeared that silver was ready to tank and go much lower after breaking its consolidation to the downside. However, after a few days, instead of seeing follow through to the downside, we saw the price reverse and build on a series of days of buying. Interestingly enough, silver and gold also managed to hold on to their gains from the ECB date also.
Since then, silver has been on a tear, with a major move on 6/19 and has essentially broken out to the upside. Lets take a look at exactly at how price has broken out on a short time frame with our first chart.
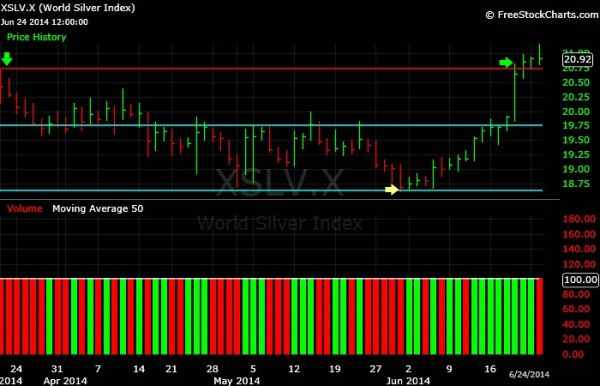
Ok lets look at few things here-
1- the yellow arrow shows us where the sellers lost the resolve on 5/30 and the price would not go lower. the low that day was 18.61, so clearly the market participants for whatever reason feel that area is of importance. From there, silver never looked back. Even the ECB spike held.
Notice the range we had, illustrated by the upper and lower aqua blue lines. On our last update, I remarked whether silver could continue to climb or stall at that point. Well, lets look at it again, take a look at the white arrow and what do we see? More continued buying, taking it past that area, and breaking out of the range it was in.
Once it broke the range, what really pushed silver up was the one day action on 6/19, that essentially helped silver break out to the upside. With the bounce at the very bottom, breaking the range it was in and the move on 6/19 that is very strong price action and steady buying. Whether it is short covering or straight up buying, who knows and who cares, clearly price is saying silver is moving up.
At this point, silver needs a breather. So the questions arise: will this be yet another fake counter trend move? Will silver give up all its gains? For a long time we have see some very vicious counter trend moves that ended up sputtering out. There is plenty of overhead resistance in terms of supply, and I reference the supply as price. I am not talking actual physical silver. Remember, price has memory. There are areas where buyers will consistently emerge and where sellers will consistently show up.
Lets look at whats ahead of silver in terms of price on a longer time frame.
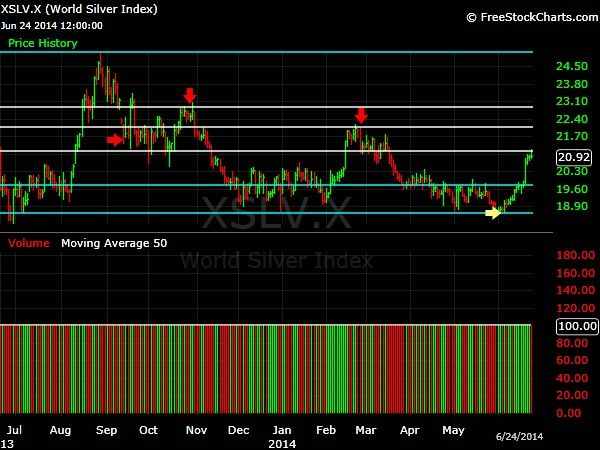
What do we see longer term? Big messy price action for sure. Ahead of silver are many areas of resistance. It will have to work itself through these areas and will probably be knocked down, all of which is normal, some these areas on this chart are indicated by the red arrows.
So we have seen what appears yet another attempt by silver to not go lower. That has been followed by days and days of buying with no real selling occurring. Silver has even broken out.
The question then is- what do we look for in order to not be faked out? If we are looking for higher prices, what is constructive?
Let me first say that again, time is needed. Only by time will we have concrete evidence that these moves are going to hold. The next thing is silver needs to slow down here. It would be ideal to see it slow down and just trade in a range for a long time, allowing it to digest its gains. The longer it does that, the better. THEN after doing that, break out to the upside, holding its gains. This would allow silver hold its gains and take out the volatility we often see.
IF this sort of pattern continues, we will see silver break its downtrend. Key to all of this was the price action on 6/19 which really catapulted silver.
-edit- sorry posted the same chart twice. Notice the second chart has been correctly changed to show a one year look. Gold charts and discussion of price action to follow in a bit or later in the day. Sorry for the delay.








 First Page
 Previous Page


 Posted 06/21/2014 10:26 pm


