Been a very sideways go no where market for silver and gold. Lets take a look at where we stand right now!
Last week I had mentioned that silver had put in a continued series of lower lows and lower highs and mentioned that if it continued that way we would could see lower prices. From Tues. all the way to Thurs. we say silver grind lower. Friday saw a bounce which occurred at the lower end of the range.
Lets take a look at the chart for a better idea of whats been happening and where we stand. As always, remember, we use charts not to predict the future but rather to see where we have been and to identify areas where buyers and sellers will step in. Only confirmation allows us to determine that the probabilities increase where the move is going.
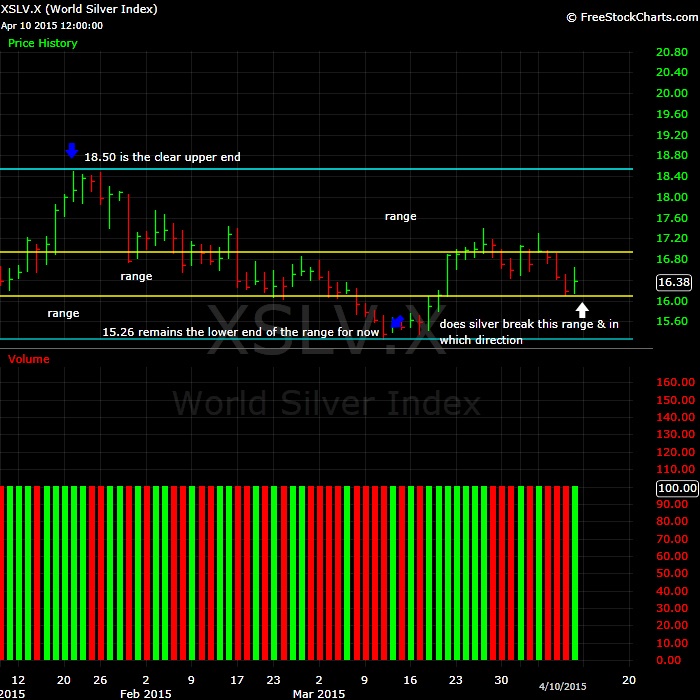
Take a look at the two gold lines we have on the chart and there one can see the range we currently have on a shorter time frame for silver. This range that silver is presently trapped in is 16.08 on the low end and 17 on the high end.
The question that arises in the coming week is in which direction silver breaks? That we dont know as we will, as always have to wait for the market to tell us.
In the context of a longer time frame the upper range of silver remains firmly 18.50, until this area is broken, for now, there is no real reason to pin hopes on much higher prices. Again looking at things on a longer time frame, on the lower end of the range we have 15.26, should that be breached the probabilities increase that we might see lower prices.
Gold
Much like silver, gold also finds itself in a range. It also last week had 3 days of continue lower highs, lower lows. (To refresh the mind, a set of lower highs and lower lows indicate price starting to stall out and or slow down,,, and higher highs and higher lows indicate price either moving higher or attempting to reverse from moving lower. This we view in the context of a daily time frame, as we measure the advance of each day and compare it to the previous day.)
This sort of continued price action in the form that gold has for 3 days with lower highs and lower low usually indicates lower prices but Friday came and a bounce materialized. Lets look at the chart.
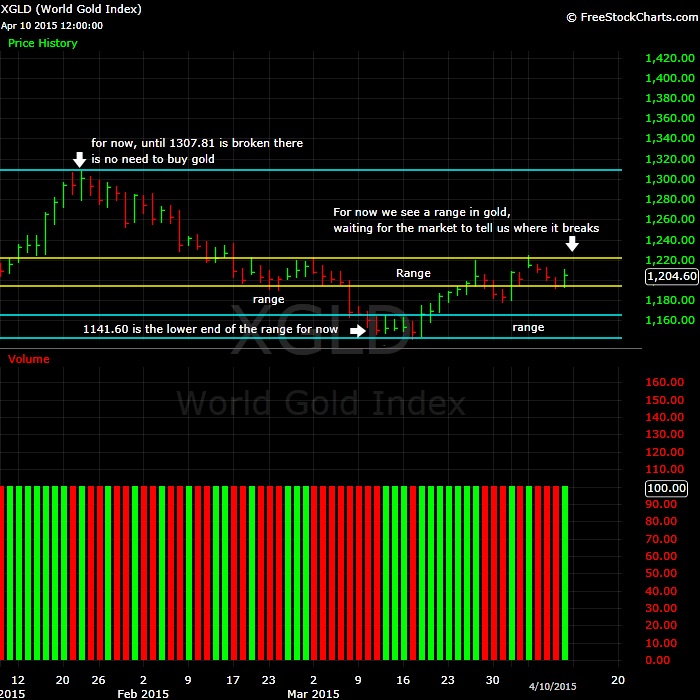
Again look between the yellow lines. For gold we have 1219 on the upper range and 1192 on the lower end in the context of a shorter time frame. We will be waiting to see which way this range is broken. On a longer time frame, 1307.81 remains firmly the upper range for now. On the lower end of the range we have 1141.60.
This sloppy go no where gold and silver price action is pretty much in line with most global assets. Eventually, this range will be broken but time is needed here. In fact, patience along with time will go along to see how this plays out.
From my standpoint, for my time frame as a trader, there continues to be ZERO reason to be involved in silver or gold. I would be interested in taking a position on either the upper range or the lower but nothing in between. There will be short time frame traders who will be trading and have been trading this narrow range however.
As we say in this biz, know your time frame. The only one we can still say with all certainty is that gold and silver still remain stuck in their downtrends. There have several counter trend moves that traders have been able to make use of but for longer term investors they are seeing no positive returns.
How long this goes on is anyone's guess. The only thing I do know is allocating big and regular purchases to gold and silver at these levels is futile as we dont have a clear direction in terms of a turn of the trend.
As always, remain patient and vigilante of price as its the only true indicator of what happens next or will happen.
Finally I apologize for the delay in charts, its been extremely busy here on my end.








 First Page
 Previous Page


 Posted 04/02/2015 07:32 am


