|
This page may contain links that result in small commissions to keep this free site up and running.

Welcome Guest! Registering and/or logging in will remove the anchor (bottom) ads. It's Free!
To participate in the forum you must log in or register. | Author |
 Replies: 5,661 / Views: 464,876 Replies: 5,661 / Views: 464,876 |
|
|
|
Pillar of the Community
 United States
3789 Posts |
@montanacmr
then if thats the case, which I have no idea why 1370 would be a big deal UNLESS you are a intra-day trader.
I will tell you this, you CANNOT be a trend follower AND be short term time frame trader.
You must pick one or the other but you cannot be both. You willdrive yourself nuts for one, and the other, the two time frames will make you indecisive.
|
|
Pillar of the Community
United States
606 Posts |
@yup
Still waiting for Livermore book. Does it detail when to exit a stock? You talk about ranges, but haven't provided much about how you determine them.
Crazy but I didn't sell anything today, but rather listened to your last few posts. Time will tell if the move was crazy.
|
|
Pillar of the Community
United States
3789 Posts |
@montanaCMR
I have talked about ranges and how I determine them, such as when we talk about silver and gold. In past charts, I have in previous charts noted the high and low of the range.. I have been talking about ranges and show how them in the various charts for quite a while. It is all based on price, right there in front of you. I am thinking that if you cant or have missed how the ranges develop this might be something that is really going to take a lot of learning on your part. Training the mind to observe price.
.
The ranges are not something that are based on any mathematical formula nor any sort of rules. It is all based on price action that develops day by day, week after week, month after month etc.
To learn the ranges any asset you are going to have to put in the work and learn, day after day.
I suggest if you really want to learn the various patterns, ranges and how they develop, get a copy of Edwards Magee Technical Analysis of Trends.
The other thing is if you dont have strong skills such as pattern recognition, you are really going to pay extra attention.
Dont feel bad, the vast majority of people fail at this point. It takes work if you dont have pattern recognition as a strength and its something you must train yourself over time. It will take constant dedication and looking at endless charts until you can easily spot the ranges.
Unless you can make it a full time experience, it will be a challenge tho I dont think it cant be done.
Edited by yup7676
08/05/2016 7:43 pm
|
|
Pillar of the Community
United States
606 Posts |
Thanks, Yup
Maybe that's why I didn't do very well in college.
|
|
Pillar of the Community
United States
3789 Posts |
@montanacmr
if I have time tomorrow I'll do a gold and silver chart and show the ranges,, as I always have.
Not really surprised that you havent caught on, I suspect most people dont either...and dont feel bad either, had a friend the other day who is not a trader ask how do I spot the ranges and even tho I showed him he still could not get it.
I think that is why folks go and pay for these newsletters and services where they just tell them what to buy and at what level. It really isn't that hard, I dont think anyways, but it does take time and effort to get familiar with them.
|
|
Pillar of the Community
United States
606 Posts |
@yup,
Thanks. Now that I know you don't use an algorithm to determine ranges, I'll look back through how and where you decided to establish the lines.
It looks like $1371 would be the current top of the trend.
|
|
Pillar of the Community
United States
606 Posts |
@ yup.
Based on some of your older stuff, I would put the upper range at $1370 and the lower range at $1320 for gold.
I looked back and it's pretty close. I fully understand how you phase in. I need to look back at how you exit. Hopefully it won't happen in metals for a while.
If prices drop below 1320, then I assume a new range forms over time. If it breaks the new range low, at some point it raises exit red flags. Or is this phase more about lower highs and lower lows?
No need to take time to post new charts. I have a lot of previous ones to review first.
Edited by MontanaCMR
08/05/2016 9:20 pm
|
|
Pillar of the Community
United States
711 Posts |
Here are the Year To Date charts for gold and silver. 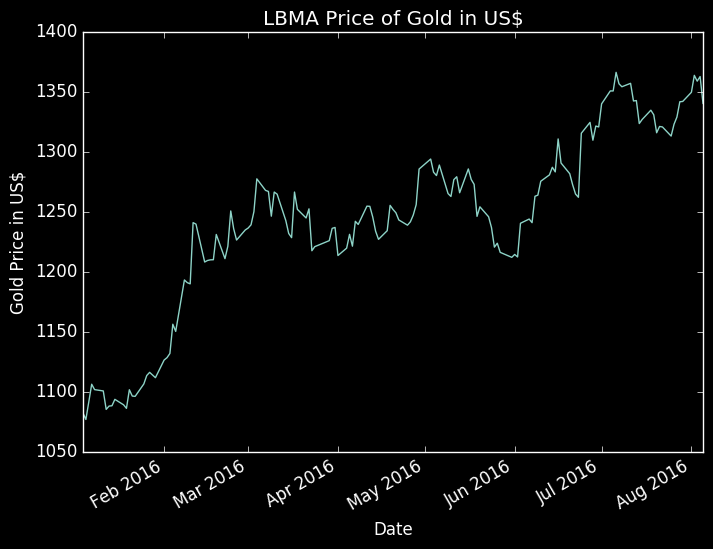 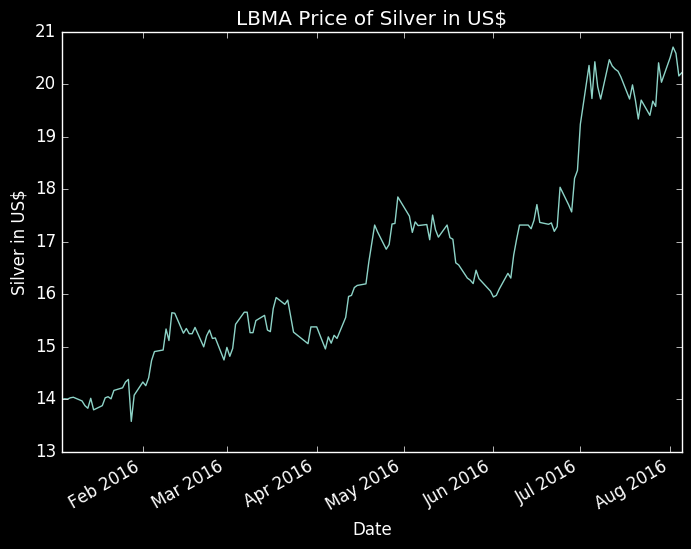 Take the gold chart for example. For a long time $1300 ($1280 ish) was resistance. Price would approach it, but couldn't break it and sustain it for most of the year, but then it did. It broke resistance or out of the range. I know I have read this from yup and many others over the years, but then the resistance becomes the new floor. If that floor is breached, then watch out, you could be in a trend reversal or they could just be hunting stop orders. Now when gold went back down, it couldn't pierce $1300, so that old resistance became the floor. As long as it is sideways chop like that, that is consolidation. Eventually the price will break out and when that break out is to the up, that is when you want to buy, but only after getting confirmation that the trend is legit. You don't need to catch the bottoms and the tops, 90% of the gain is more than sufficient. Day trading or swing trading is completely different though. You are looking for a gap up to fade or some other intra day stuff. You can make money at it for sure if you have the discipline and the bankroll to ride out short term variance. Easier money by far in following the trend. I have no data, but likely more profitable as well. |
|
Pillar of the Community
United States
606 Posts |
Thanks Buckeye.
I've just finished reading about 30 pages and stop losses are described as critical. However, nobody, including yup, has indicated a stop loss for gold.
yup talks about bio tech and if price moves to 84, he might move stop loss to 83. We dropped $25 today, but that doesn't trigger a stop loss? What about the bottom of the range? Say $1320? Or do you wait for several range crosses?
Any recommendations for stop loss for gold? This may be the on,y topic related to gold on this thread that hasn't really been established.
Edited by MontanaCMR
08/05/2016 10:25 pm
|
|
Pillar of the Community
United States
606 Posts |
@yup,
If patterns and ranges doesn't work for me, I found an amazing research study that looked at stocks over years to examine stop losses for Long term trades. 15% was the optimal. I'll find the link and post it.
I'm going to look back from February and see if it ever got close on the fund I picked up. What I like it is tells me what my min profit is now and still have no set time or price given if a new high is hit, it becomes the new basis.
I would still need the ranges to determine if a base is formed, but using your very specific ideas about phased entry and an optimal stop loss, it might finally be a reasonable strategy. I recognize gold is probably different than stocks in the study, but something like this could be optimized through data simulations.
Thanks again for all of the help during the past few months. I think you have FINALLY answered all of my questions. Sorry I asked so many, but you have been a great source of information based on your trading experiences.
By the way, my analyses is based on the mutual fund I have which is pretty steady. For instance, I think it lost about 2.5 today. It's still above 55% since entering, which would mean about a min of 40% trade. More if it doesn't drop another 12.5%. So if I invested 100 back in early March, I made enough for lunch for two. If it keeps going up, maybe dinner for two.
I wonder if I should quit my day job just yet :)
Edited by MontanaCMR
08/05/2016 11:53 pm
|
|
Pillar of the Community
United States
3789 Posts |
Not sure if I am the best person for teaching lol I say that because I come from an environment where you keep it simple, things never change, and dont over complicate things and you must be ready to learn on the fly and keep up with the learning curve so sorry if I tend to get impatient perhaps?
I dont mind the questions and I will certainly try my best to help, there are no dumb questions as they say and nothing wrong with not understanding something.
You say I havent said a stop for gold. Well, before we can even talk stops, what asset is you are putting money into? Are you trading straight up the commodity? Or are you trading stocks? In your case its probably stocks, gold miners.
There are many different types of stops and trailing stops. What works for me will NOT work for you. You are going to need to find a stop/trailing stop that works best for you and based on your experiences with whatever asset you are investing in, and what kind of stops/trailing stops are comfortable with and can tolerate.
Some examples of stops are sometimes doing percentage stops. Livermore's rule was always a 10% stop. I do use 10% stops with certain assets based on how they act. Sometimes I use a 1-2 point stop depending on where I got in and again on how the asset works.
sometimes a stop will have to be adjusted to the market conditions. sometimes a stop can be too tight and needs to be given more of a leash other times you need a tight stop.
Some traders like using a stop based off moving averages.
I cannot tell you EXACTLY what type of stop to use because its up to the individual on what they feel COMFORTABLE with.
also, the stops one uses center also around ones TIME FRAME. I have repeated myself over and over you have to work with a time frame and stick to it.
If you are working with a shorter time frame, then your stops/trailing stops are going to be tight and short. If you are swing trader, your stops will be dictated on the range you are playing. If you are a trend trader, like me, you stops will tend to be a big longer. I use 1-2 stops and percentage stops depending on the asset. Experience tells me whats best because the patterns repeat over and over so I have a good hunch whats going to work best.
EXAMPLE. I am trading GLD. the 52 high is 100. I buy as soon as it crosses 100 because I buy 52 highs. I buy 1,000 shares. 1000 x 100 = 100,000 put into the trade. My stop will be 10% of that. If it breaks 10% I am out period.
Another trader might say, I am going to just play the reaction from the 52 high. So he buys as it crosses 100 and it goes and runs below that, he uses a 2 pt stop. He is OUT at 98.
SIMPLE.
Generally speaking, you do not want to lose more than 10% of what you go in, I can tell you from experience 10% is MORE than generous. IF that doesn't work then that asset is clearly going much lower. Also, stops beyond 10% ... well you have to work a TON just to break even.
So those are some suggestions on placing a stop. Remember too, stops should be placed in an appropriate manner from where you are buying. Say gold has been running for weeks and you buy after its been running. Chances are high if it hasnt pulled back properly and you buy in, you are going to see it pull back on you. In that case, you want to do a point stop and just wait for it to reset.
so let me repeat myself, BTW I have said these things OVER AND OVERRRRRRRRRRRRR on this thread.. but again... with stops...
1- Time frame is important
2- what asset are you trading
3- what are general market conditions
those are key points to keep in mind. IF you do this long enough and dont blow your account, you will in time learn whats best.
I think you are confusing yourself in a sense. doesn't matter if you trade pork chops, tin, baby diapers or US dollars, whatever amount of money you put in, you put some sort of stop. There is no book or rule that says every single asset that you can trade has to have a written out specific stop. Rather, whatever you put in, you determine an exit whether it be 1-2 points or a percentage. this is very simple stuff.
With my biotech example, it seems like the point was lost on you. I believe I was talking about how I move UP a trailing stop to gather profits from playing the break out.
You talk about gold dropping 25 bucks today. Ok so now what? You ask where is the stop at. Well, that is going to depend on WHERE the asset was bought.
Anyways, those are some ideas for you to chew on about setting stops. No MATTER WHAT THO, as soon as you buy something and the money is in the market, from that point you place and assign it a stop. PERIOD.
EXAMPLE- You talk about liking to jump in and out. Say you bought the dip on CDE and it falls to 13 and you buy it at 13. A logical stop would be to not let it go below you at 12, if 12 gets hit you immediately sell, asking no questions.
I repeat again also.. every trader that knows his time frame sets his stops according to his time frame. EXAMPLE- A swing trader, if he is say buying 1200s in gold because that is the low end of the range and the high end is 1300, if that pattern continues he will continually buy the 1200s hold until gold gets into that upper range near 1300s and sell and then start to sell it short on the way down to 1200. In his case, he is not going to put a percentage stop but rather he would do a point stop such as in the case if gold hits 1200, he buys 1200 and then say it drops to 1185, he would get out.
I dont know how else to further simplify this or fit in anymore information. I hope that helps. The other thing I could try and do is you have to tell me which stock you are looking to buy and I can give you some suggestions on stops so you can put them into play.
|
|
Pillar of the Community
United States
3789 Posts |
@montanaCMR
Yea, I have heard of 15%, I have even known well respected traders that held out to a whopping 30% stop. Just keep in mind tho, the wider the stop beyond 10% and the more work it will take to get to break even.
In fact sometimes, stops are modified in the process of the trade due to unexpected circumstances, such as a sudden turn in market conditions. In other words, giving a longer stop is not worth taking.
Again, no worries on asking questions, I am happy to help even if it seems like I am annoyed (maybe I do get annoyed LOL) but no, all kidding aside, I am glad to help, I want to help, this game is tough but one can win at it, provided you are willing to get kicked in the teeth repeatedly and often in the mouth by the market.
Look, if you are ahead by 55% in your mutual fund, dont sweat nothing. You have a good cushion to ride out the pull backs, the flat time periods etc. For a trend to run longer, there have to be corrections or pull backs. They are healthy and help the trend along. Also, remember that gold and silver, or any asset for that matter that breaks a downtrend, on the way up is going to go through levels or overhead supply. Its normal.
Just a personal story of riding a long term trend specifically with gold and using the gains as cushion and I have done this with all sorts of assets that run for multi-years.
Back when we saw this first run up in gold, GLD, the gold ETF came to market. I think this was about 05. The first yearly highs came in around 40ish, so I started building my position there. I let it run, it kept climbing, so I added again in the 55s, again yearly highs. I let it run some more. I saw dips, pull backs etc.
Some of them whittled down the gains but the trend was still there and sure enough, gold would recoup and again be at 52 highs. After one very sizeable dip that corrected prices I added at the 72s, and that was my final line. I believe in one year I had already established my full position.
You know I rode GLD from 2005 until all the way into 2011 where it hit the 185s where it peaked. I then gave it a WIDE trailing stop since I was sitting on HUGE profits, I am not interested in nailing exact tops as thats NOT my game and it cant be done 100% of time. I finally jumped out in the 120s.. still with great mind blowing profits.
So my point is- so long as the trend is fine, let the profits ride. that 20% will turn into 50% that 50% will turn into 120%, that 120% will turn into 200%. Point being dont be early to cut profits, let them run because a strong trend can run for much longer than one thinks possible.
Just let the market do the work.
|
|
Pillar of the Community
United States
606 Posts |
@yup,
Thanks for taking time to respond. The study supporting a 15% trailing loss is found at quant-investing.com and had decades of data beyond what Livermore would have had access to. The presentation of this research was very well done.
I might end up splitting the difference at 12.5% and adjust either up or down a bit based on the trading range data you introduced to me.
It's interesting to me that your system combines both science and art. Science based on 52-week high tracking and art based on your ability to create ranges without algorithms.
I hope you have a great weekend.
|
|
Pillar of the Community
United States
606 Posts |
@Yup,
This is just a one time question looking at a chart for Energy (VGENX). It currently looks to be testing the 52 week high for a second time. IMO, this has a similar, although not as good as metals, set-up. Agree?
Also, I've been reading as much as possible on Jesse Livermore before the book arrives. You both seem to have a very similar approach :) and I think that is a smart strategy.
|
|
Pillar of the Community
United States
3789 Posts |
@MontanaCMR
yes, chart looks good. Not a fan of mutual funds, dont use them but this looks good price wise.
The next 52 high is when it hits 50.81, at that point or say 1 point above that price would be a good spot to pick it up.
Yes, this is an asset at yearly highs, so it is worth buying. The only thing I dont like is some of the underlying stocks that make up this fund, the price action in a few has shown then at the start of break downs but so long as the overall fund keeps going for 52 highs, it is worth it.
Thanks MontanaCMR, Livermore left some very good templates to work with and DESPITE it being almost 100 years back, they are STILL used to this day by trading firms all over the world as the same rules apply.
|
| |
Replies: 5,661 / Views: 464,876 |
To participate in the forum you must log in or register.
Disclaimer: While a tremendous amount of effort goes into ensuring the accuracy of the information contained in this site, Coin Community assumes no liability for errors. Copyright 2005 - 2026 Coin Community Family- all rights reserved worldwide. Use of any images or content on this website without prior written permission of Coin Community or the original lender is strictly prohibited.
Contact Us | Advertise Here | Privacy Policy / Terms of Use
|
| Coin Community Forum |
© 2005 - 2026 Coin Community Forums |
| It took 0.58 seconds to rattle this change. |
 |
|
| |
| |







 First Page
 Previous Page


 Posted 08/05/2016 7:18 pm


