ok lets get right into it-
lets first look at gold. We had our breakout at 1255ish last week and prices followed through higher. As far as break outs go you cant ask for more, it would have been a nice quick profitable trade for those that took it.
So now what? Well there are several paths this can take, all which will decided by the market. To begin with, one must count on gold running into overhead supply. A pull back is realistic and should not be surprising at all. What to look for then? Lets look at our first gold chart for some answers.
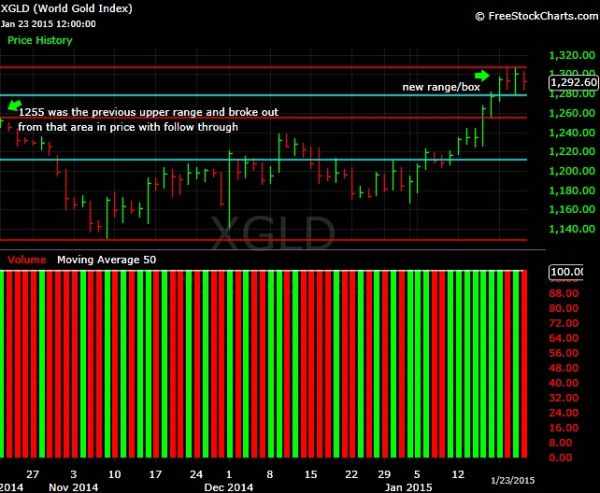
Allow me to point out some things on the chart. First, nice the green arrow at the far LEFT side of the chart. That was the upper range, the 1255 area and we see how last week it broke out from 1255 and moved higher. Notice now where gold stopped last week. No surprise that we have a new range or box forming. Instantly we can see a range. with a low end roughly of 1276 and a high end of 1307. That is the current range as of now for gold.
NOW this is what is key-
1- one would prefer to see this range just chop around for now staying within the range in prices we talked about earlier for an extended time whether that be weeks, months, etc. The longer the better to determine what happens next.
2- IF gold breaks 1307 higher, prices are going to follow higher. If we break the low range, then gold perhaps first wants to retest much lower before its next move. Testing the area of a break out is not unreasonable and I have seen it before.
Again, this is a function of time. Time will tell us which way prices break and how far. Is it possible for gold to break 1307ish and move higher and hold? Yes it is, I have seen this pattern, tho its not always the best. Its also possible it breaks lower out of this range tho based on the action on December 1st and what important breaking of trend lines happened recently, I think probabilities are for higher prices.
Keep an open mind and keep your emotions in check. Nothing is guaranteed in markets. I repeat, breaking 1307 gives us higher prices, breaking the range on the low end and we get lower prices. It is simple as that. I want to also repeat that there is a lot of overhead supply so do not be surprised by pullbacks. Pay attention to how deep or shallow they are and as I said last week, we can correct via time OR price.
Lets look at one last gold chart-
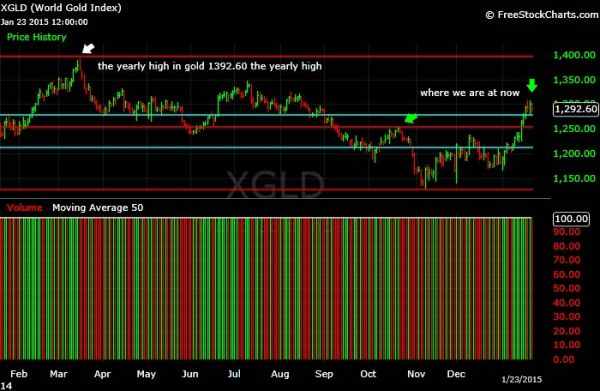
This is a yearly view of gold. The yearly high is 1392.60. Couple of things-
1- Gold will have to run through all these areas of price in order to move higher. There will be sellers. However, this does not mean that gold stalls out, if there are enough buyers, it can move through this, level by level.
2- If you think about it, the yearly high isn't that far away. With gold and how commodities move, a 90 dollar move can be attained with steady buying and time. So to me, the yearly high is NOT that far away.
3- The CLOSER we get to that yearly high, the more and more the downtrend has been stopped and is in the rear view mirror. Once it hits the yearly high, gold is in a solid uptrend. Simple. So again, keep 1392.60 on your radar.
Now to silver-
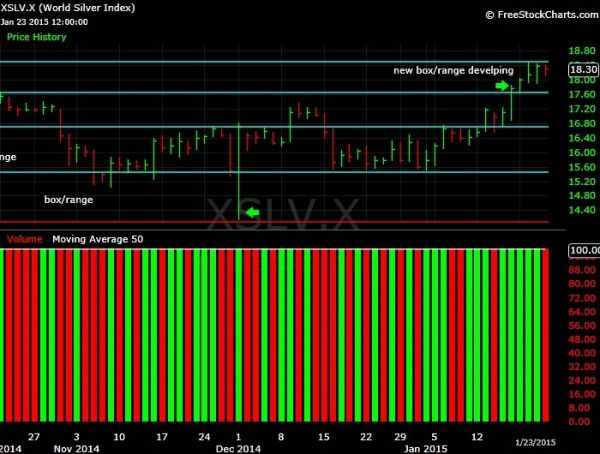
Pretty much the same thing as gold, which is NO SURPRISE. I see these type patterns in all sorts of assets I trade. OVER AND OVER AND OVER. There is nothing new at all in this. Once again, we had a breakout with follow through. See what I see? Yet another range or box develops and its clearly marked.
The high end is 18.50 on the upper end and 17.63 on the lower end. For higher prices, 18.50 needs to be broken. Lower prices will come on a break of 17.63. As with gold, the longer the range, the better we can get a break of the range. Whether it moves higher or lower will be up the market to decide, just as with gold.
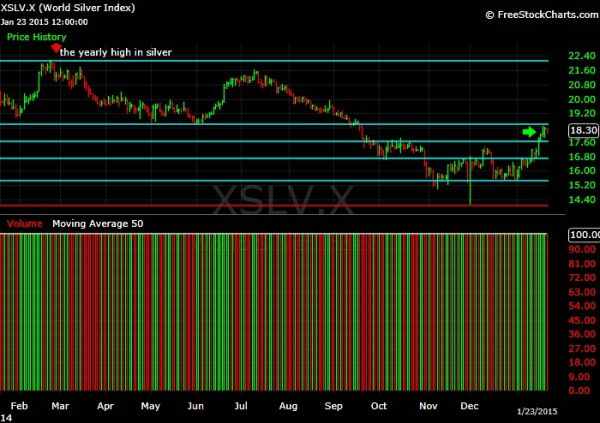
Here is a yearly look at silver. 22.18 is the yearly high. Just as with gold, notice all the levels that are between where silver stands now and the yearly high. But again, to me, I think with steady buying and time, this is not out of reach. As with gold, if silver does in time hit 22.18, it is in an uptrend. This never changes and is always the same. Assets at yearly highs are in uptrends and the move is starting to get stronger for higher prices.
That's our wrap up for this week. Pretty simple stuff.. nothing complicated here and this is how it always is for all traded assets. They all come to important areas in terms of price and either they break them higher or lower or trade sideways.
My final thought is that time is key here. With enough time, we'll find out whether this is a big head fake or steady levels being taken out higher. I see constructive price action thus far and while I have repeated myself a thousand times, that price action in the overnight futures market on December 1st really got my attention that night. To me that was a major turning point and it will be validated by the PM's moving out from there as they are.
Also, as a side point, its interesting to note that gold and silver have moved higher WITH a stronger US dollar. So remember, do not pin correlations as a constant. They are NOT constant, they come and go and separate eventually.
To recap- constructive price action thus far for silver and gold. Now we get to see how much they pull back. A pull back is not a bad thing and should be welcomed. What one should focus on is how the pull back happens. Will it happen by time or price? Perhaps prices trade in a range as we discussed before moving out. It is feasible that we see continued buying that pushes even higher. On the other hand, do not rule out a pull back in price.
Again, ALL these questions will be answered by the market and how it proceeds will give us countless clues via price. In the end, price is the ultimate guide and NEVER lies.
*should have said LEFT not right the first time regarding the arrow*







 First Page
 Previous Page


 Posted 01/24/2015 04:11 am


