should be an interesting week as we have gold and silver breaking key levels and weak, yet they are doing it in a manner where they are being stretched on the downside which increases the chance for a bounce... which depending on how much it bounces, could still set up silver and gold for more weakness in terms of price.
lets get right into the price action, as it is the only thing we know to be true and can only trust. Nothing matters to the markets except price action, as it acts and moves before any sort of news. Without paying attention to price first you will be at risk of not really knowing whats going and therefore we always follow price first.
First up is gold
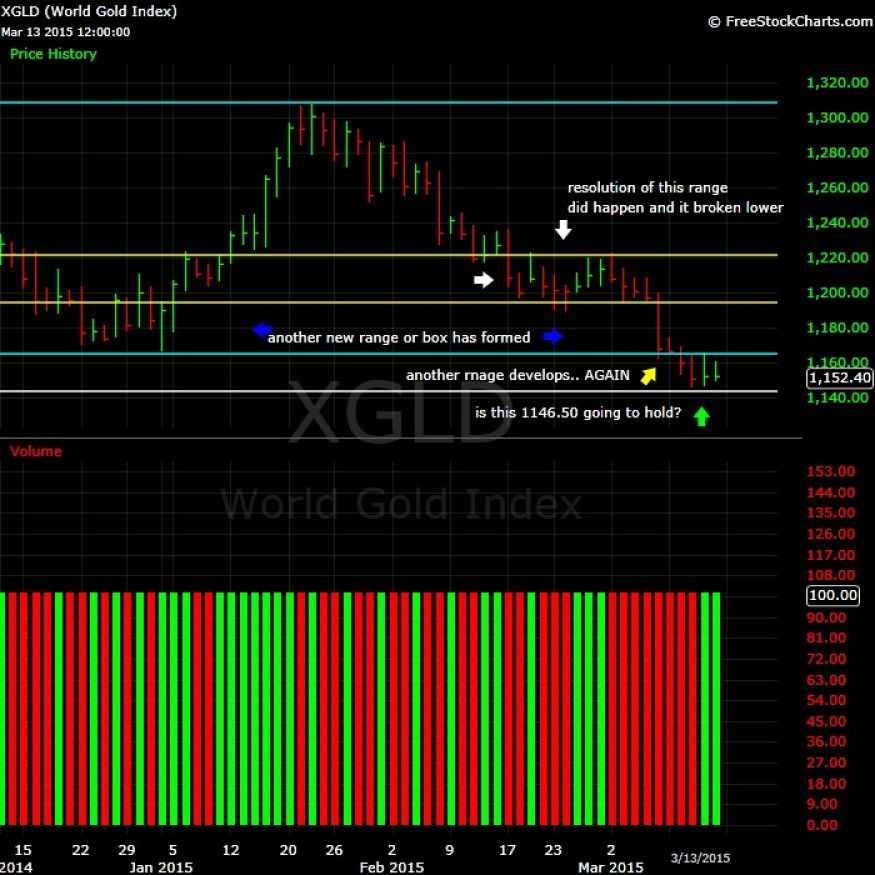
Last we talked about gold we saw we got a resolution and that was a break lower. From there we saw gold break down lower, in fact a total of 8 days went by before we saw a bounce. From here what do we see, what is price action saying?
If we look at the chart we can see we see several things. First take a look at the yellow arrow on the far right. There is the leg lower on 3/6 which was a big day down. That was followed up by two more days lower. At this stage, those who are selling short are already in the trade from higher levels, those who choose to enter now risk getting squeezed or having to cover there positions as there isn't a proper low risk entry. That is where we see a bounce for two days.
this is the thing: does this hold? There are several negative factors here, one being that gold cannot close at the high of the day (HOD) on each of these days, and instead closes on the low of the day (LOD). Typically, this type of price action gives us further clues as to how weak or strong it is.. in this case the bounce is very weak and anemic as we see gold closed on the LOD.
YET... this does not mean that lower prices are guaranteed immediately and that one goes in charging with a mind set that prices are going lower and to sell it here. What is missing is confirmation for lower prices and then confirmation.
So, the key price level to watch this week is a break of 1146.49. As a trader I will be looking to see if that prices breaks to sell a line short. In a typical set up, this price will break, lower prices ensue and then more selling pressure should see a gradual push to the yearly lows, 1130.40, which in turn, when they are broken will bring in fresh, new yearly lows in gold. Another possibility on tap is that 1146.49 is broken followed by counter trend move.
So keep an open mind as anything is possible. However, seeing we are now probing and inside those December 1st overnight lows, lower prices are a high probability. Again, be patient and pay attention to the price action. Key number to watch this week will be if 1146.50 holds.
Silver
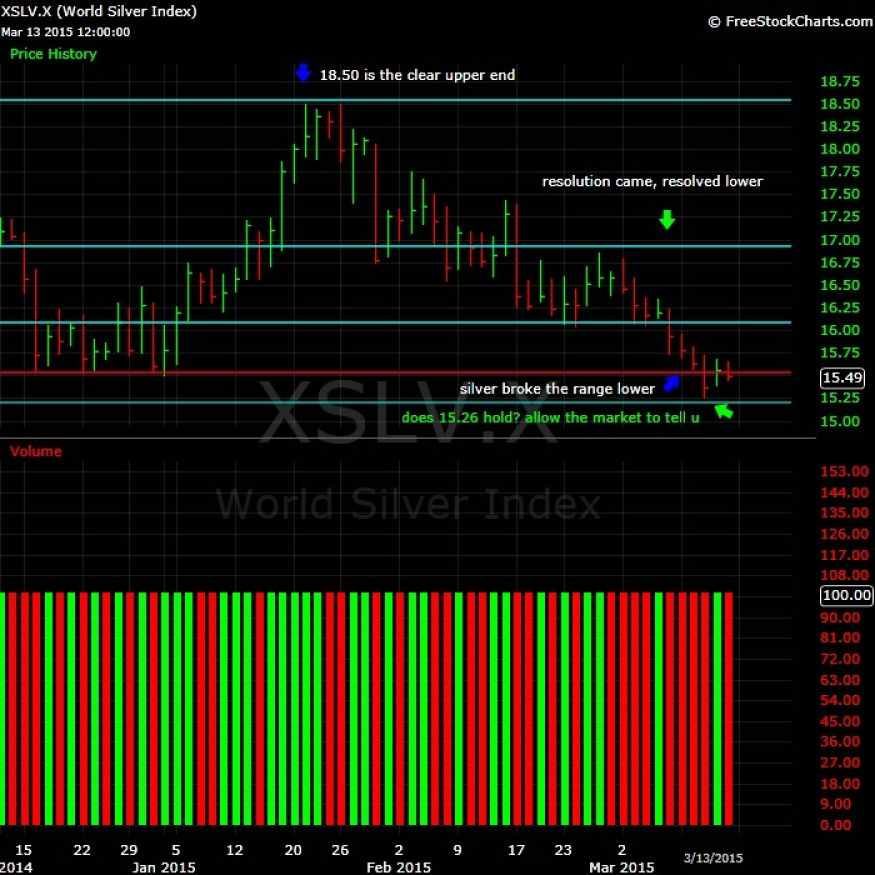
Surprise Surprise! Silver also managed to follow the same price action as gold. Last week we saw resolution, a break lower. That was followed by more selling in silver. Several days of selling brought us a bounce, followed by some minor selling. Pretty much the same price action as in gold. Again no surprise tho, as this is very common and typical price action. Key number to watch for this week is 15.26. does this hold or not? Allow the market to decide that but if 15.26 breaks, lower prices are on tap in silver. Simple.
One interesting nugget is that on Friday, despite all this selling in silver, on Friday, it did not make a lower low. In other words, it did not break the previous day low despite all the selling. Nevertheless, the situation in the present is that silver is also inside that December 1st overnight futures low. The probabilities are high that more selling gets silver also into yearly lows.
Just as with gold, a break of last weeks lows gets silver closer to its yearly lows of 14.15. A break of 14.15 will bring fresh yearly lows. To repeat, keep an eye on silver and see if 15.26 is broken as thats the key number this week.
So we have the two price points to watch in gold and silver. Both PMs are in my opinion sitting on key levels. The probabilities are very high for lower prices ahead. Can a bounce happen from here? Sure. The question tho is do they hold? It is hard to imagine that they do being so close to yearly lows and that is why it is key to listen to what the market communicates to us via the price action.
As a trader, a break of those levels are a typical sign of taking a position to sell lines short as the confirmation is present. Does this mean it happens 100%? No, if you notice, trading is a game based on embracing uncertainty and putting as much of the probabilities as you can on your side... and even then, those do not guarantee a sure 100% conclusion.
In any case, we have now the keys numbers to watch these week, now all we have to do is be patient and watch the market!






 First Page
 Previous Page


 Posted 03/11/2015 10:45 am


