Just a few points here.
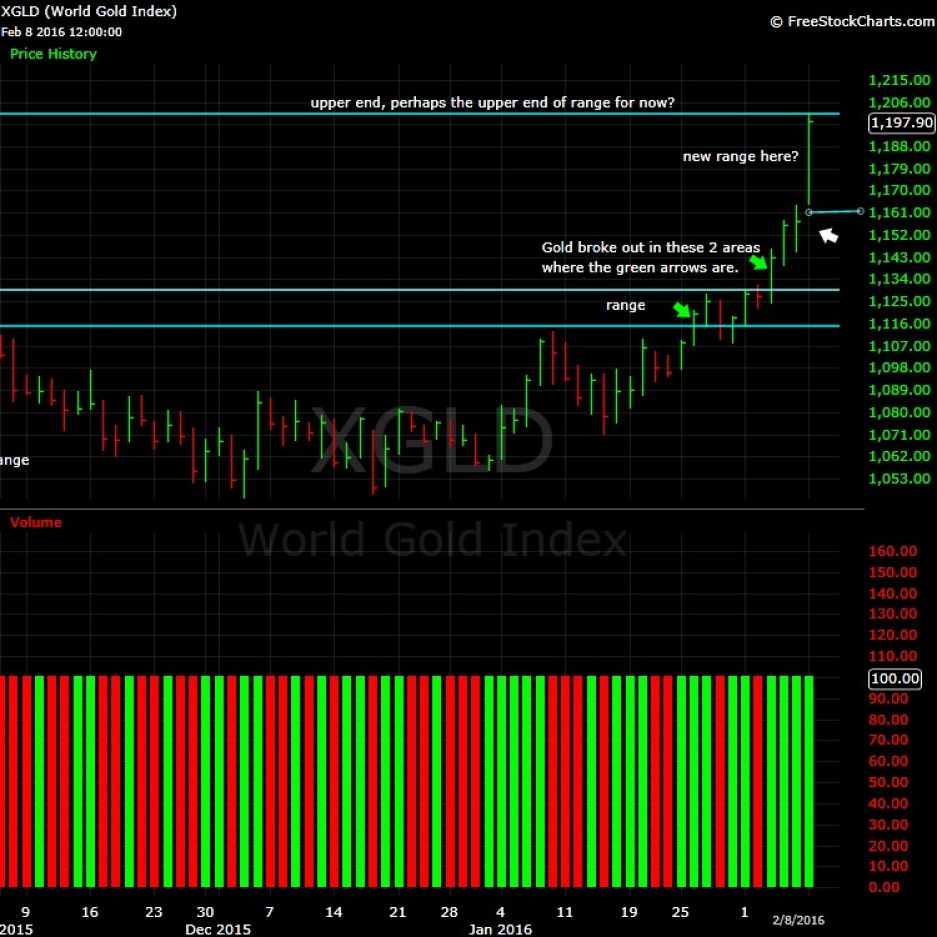
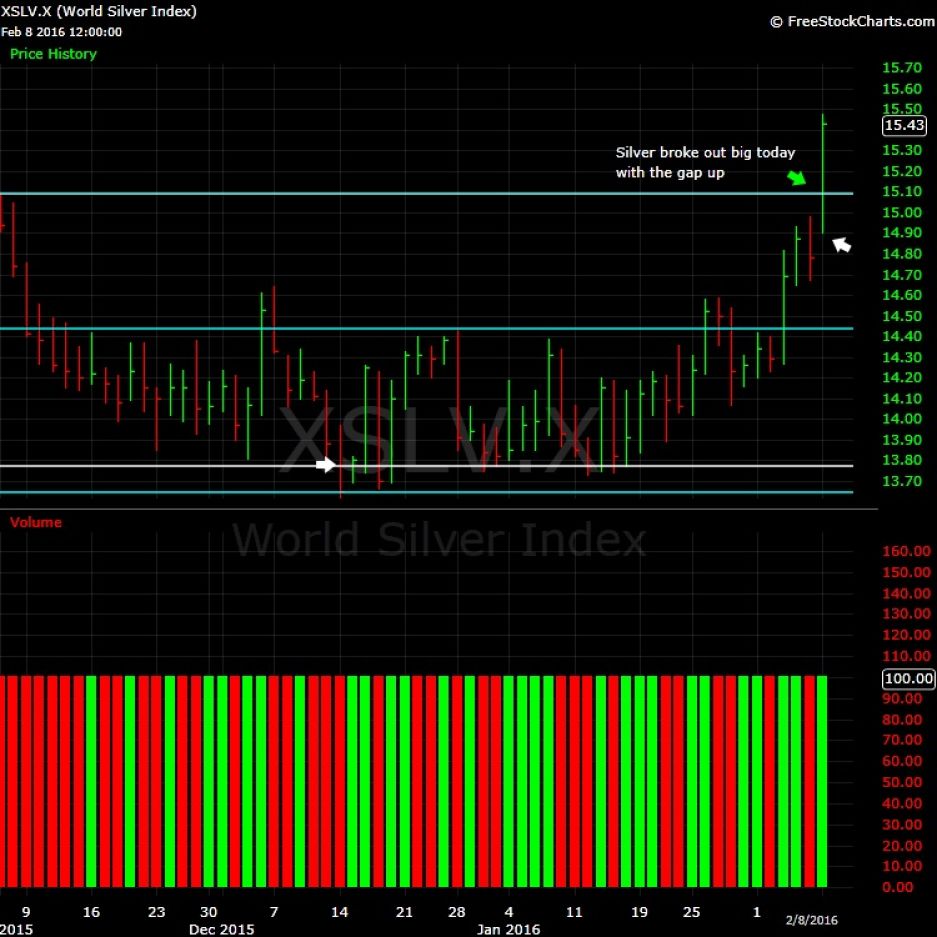
Gold pretty much had a gap up and ran higher all day. It ran all day and closed at the highs. Same deal with silver, which broke out today in big fashion and caught up with gold.
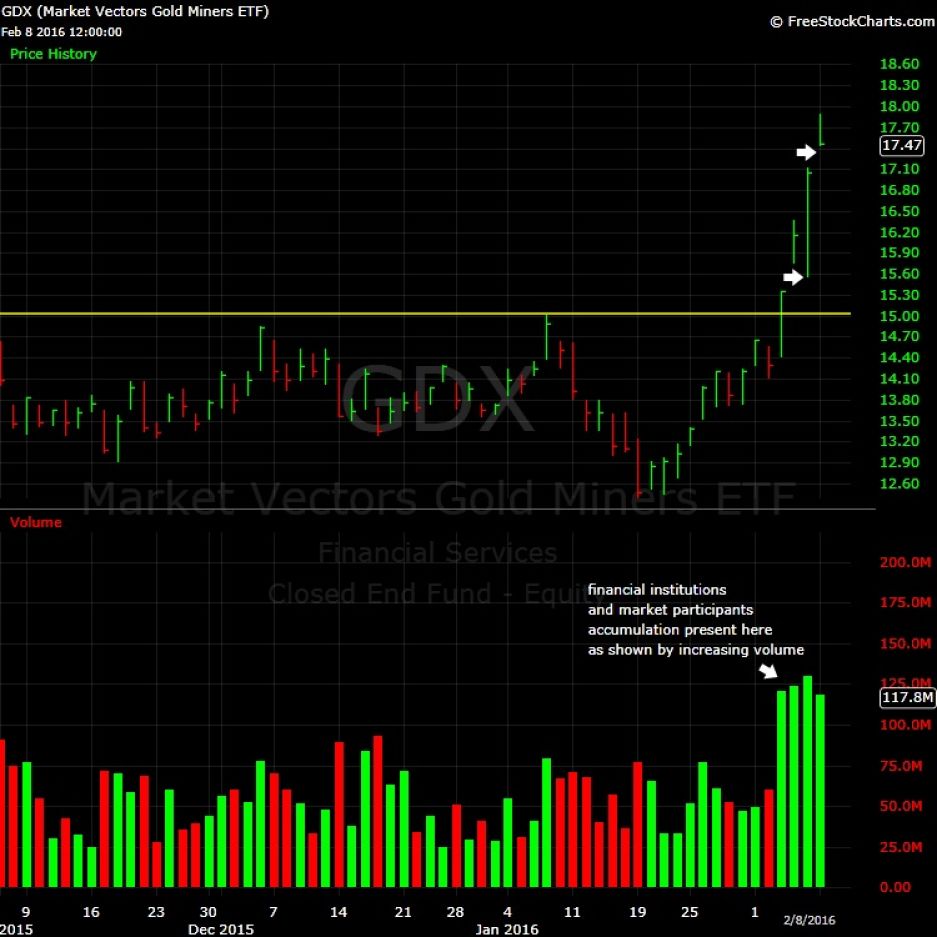
I did notice the miners also had a gap up today and managed to close the day on the lows, signs of a reversal in price that is coming.
Very briefly here-
Expect a pull back of some sort. How deep it is, how much, have no clue.
The best scenario for gold and silver is that they remain range bound, that the pull back is shallow and that this happens for some time, allow the move up or the b/o that occurred to let that move be digested over time rather than via price.
The other scenario that could happen is after some pull back, prices start to set a series of lower highs and lower lows, indicating that gold and silver want to move lower. This could happen and it is entire possible that the first b/o areas on gold and silver are tested.
In other words, some of these gaps might be filled on the way down. From a purely technical stand point, expressed by price, this would not be surprising nor would it necessarily mean the move up is done. sometimes these gaps or b/o areas get re-tested and price bounces from there and moves out higher, breaking out of a range.
Remember too, we do have plenty of overhead resistance or supply and I am not talking about physical gold or silver but price. These will be areas from the past where sellers and buyers show up, in this case sellers will be present.
So pay attention to how and in what manner gold and silver act in the coming days, it will give us clues about who is in control, the buyers or sellers.
please refer to our chart from our last update to see where we were and how we broke out to better understand how break outs and ranges work.
On the gold chart I have illustrated the gap up, look for the white arrow, right there is the gap up today. is this going to set up as the new range? Time will tell.
With silver we can see the clear big gap up that helped break out silver. At the white arrow, there is our gap. As with gold, will the lower end of this gap set the lower end of a new range? Again, time will tell.
Finally, I want to show you the GDX miner ETF. It has been on an absolute tear these past 5 days. Straight up buying and accumulation and got pretty gappy today which probably means with the reversal today, that the buyers are tired for now and ran into sellers. What is impressive tho is the accumulation by market participants.
How do we know this? We use volume, after price, to determine how active participants were and what they were doing. This is how financial institutions and market participants leave another sort of "foot print". Accumulation happens when volume increases from the preceding day.
Please refer to the lower part of the chart where the bars are, you will see on the far left in red it says "volume."
I have placed a white arrow at the first volume bar. On 2/3 volume came in at
120 million shares. the next day, 2/4, volume came in at
122 million and on 2/5 volume came in at
129 million shares. That is called accumulation, as each day, volume increased.
I havent seen gold and silver miners do this in LONG time as in years. In fact last time I saw this happen was when silver and gold were in and starting their up trends. So with the price action and volume, we can say the market wants these miners and is putting money to work here.
Now, we have two gaps here. They are marked out with the white arrows. Also notice the price action for today, notice the "L" shape? that shows the price action for today, marked out by a high of day, which was 17.90 and the low of day was 17.44 and the final price for today, which was 17.47. Clearly the buying ran out of steam as GDX closed out at the lows.
In most cases, this means the start of a pull back and the buyers are tired and I would think that, seeing that the miners have been in a downtrend, that is completely normal to find areas where sellers step in.
This again tho, before a determination can be made, has to be allowed to play out. Which gap are we going to go into? How deep will it be? Again, time and price action will give us clues.
So there you have it, that is how we stand. If I missed something or something doesn't make sense, let me know, I am rushing to put this together as I have other things to attend too but I wanted to get this out, been a pretty interesting start and end of last week in terms of price action.
please see the corresponding charts below here






 First Page
 Previous Page


 Posted 02/08/2016 3:46 pm





