|
This page may contain links that result in small commissions to keep this free site up and running.

Welcome Guest! Registering and/or logging in will remove the anchor (bottom) ads and the security checks. It's Free!
To participate in the forum you must log in or register. | Author |
 Replies: 5,661 / Views: 465,196 Replies: 5,661 / Views: 465,196 |
|
|
|
Pillar of the Community
United States
3843 Posts |
Silver at $14.69 down $0.42 as I post this. Very steep sell off over the past few days. Gold seems to be not as hard hit as silver has been, not surprising since over the past few years silver has seen much larger percentage declines than gold. Looks like the stackers on CCF may get an opportunity to add some more shiny PMs to their stacks at lower levels.
|
|
Pillar of the Community
United States
606 Posts |
Yup, I do agree with your analysis of purchasing individual stocks that are at 52 week lows as this could be an indicator the company is in trouble. You make an excellent point regarding stocks.
As you know, I am a fan of real estate. You ask about buying assets in a declining market. I think real estate is one that CAN make sense in a declining market. For instance, I purchased a house (I'll just use sample $ amounts) during a real estate crisis for $100,000. When the market improved, it sold for $170,000. In 2008, the price of the same house dropped to about $125,000 and I thought about buying it again. I didn't, and its now increased to about $165,000.
Had I bought this property at it's highs, I wouldn't have made anything.
|
|
Pillar of the Community
United States
3361 Posts |
I'm not saying that dollar cost averaging is the best strategy. My dad dollar cost averaged energy royalty trusts for decades. High yield, super depreciable, and the investment strategy was bone-stupid "buy more always". I liquidated the estate just before energy fell off the cliff, and since then these trusts have lost 80-100% of their value. Was his dollar cost averaging strategy the kiss of death? Certainly not, and it left my mom with a nice cash position. Would he have sold on the peak? I'm guessing no, because he was still plowing the dividends into new purchases when he died. He was in love with the high yield and depreciation, and that blinded him to ever capitalizing his substantial paper gains.
Dollar cost averaging worked very well as an investment strategy over decades. It worked through 2000 and 2008, because there was time to recover and the buying at the bottom paid off. If I hadn't liquidated, it all might recover again by 2020. But with this strategy you have to have the discipline to exit at the top, whenever it occurs.
"Two minutes ago I would have sold my chances for a tired dime." Fred Astaire
Edited by thq
02/26/2016 6:55 pm
|
|
Pillar of the Community
 United States
3789 Posts |
@MontanaCMR
I know what you mean about buying assets at yearly highs and seeing nothing. Thats why, you will notice in this thread, we are always looking for, and trader is always looking for the turning point in an asset...
often times, with assets we trade such as equities or currencies, or other assets we trade, BEFORE an asset even hits a yearly high, important areas in price are broken, suppose in this case we are talking about breaking out of a downtrend.
So perhaps a range of 56, as an example, is a key area of breaking upward... and that area gets broken BEFORE even a yearly high is present,,, that usually is a step in the right direction and then, in a matter of time, you have the yearly highs follow, which gives you further confirmation.
Now clearly, if say an asset is hitting yearly highs and its in the 3rd year, obviously caution should be exercised as the move is extended from where its coming from.
However, the basic rule remains- assets at yearly highs go higher. What is important with this rule is also to begin buying whatever asset it is, as it breaks upward, to be right there as the move STARTS..
there are places to buy within a multi year uptrend as well. As you all might recall, with gold, I was buying in the 400s, I watched and added in the 500s, and then I added lastly in the 720s.... and then I stopped averaging up and let it run. Again, as I bought up, I watched for the reactions along the way up.
Going back to this thread, that is why I say we are at the start of the uptrend again. We cracked the 52 highs. Gold miners are also following along. Now we are seeing a pull back which is OK.
Buying gold again in these areas, where the uptrend started is proper. IF you want further confirmation, one could wait for the next 52 high.
So I do agree with your example, I think Real Estate might give a few more variables that remind me of say stocks. Ialso think that if you had prices on a chart and traced propery that tanked and started to make yearly highs, it would break higher in time.
Historically, if you averaged into the SPX and kept buying over all the years, and you price in dividends, you can do alright and a lot better than being in cash. I think the main problem is that when you need the money, the amount might not be what you need...
But again, with financial markets, I know for a certainty, seeing it happen with my eyes many times, if you are buying equities, currencies, commodities or bonds that are in yearly lows and declining and you average in, it is the kiss of death. It is a losing proposition to average into something declining and really no amount of time is going to help the situation.
|
|
Pillar of the Community
Canada
3049 Posts |
thq: this is where I will have to respectfully disagree with you about DCA...
if you buy a single share of a stock at $10.... and it drops 20% to $8.... and then buy second share.. you're into the stock for $18.. meanwhile it's only worth $16
If it drops again to $6 and you buy yet another share.. your net cost is $24 yet your net value is $18
In short you're throwing good money away.
If a stock went from $10 to $5... you would say it has lost 50%.... but for a stock to go from $5 back to $10 it needs a 100% growth/gain!
This is why you're sooooooooooo much better off just cutting the losses... and waiting for the market to create an uptrend buy high... sell higher!
What YUP has been talking about regarding price action... the BIG money has to support it! These are financial institutions, Banks, investment funds and such... as they start to buy in and give support to a stock or commodity than you should to... Be the smart money and follow the BIG money
|
|
Pillar of the Community
United States
3789 Posts |
So just a quick note, we'll look deeper this weekend but briefly--
we saw the continued break down in gold miners, no news flash here tho, remember we talked about the DG coming in just as the miner, GOLD, in this case, hit 52 highs. We saw weakness all across the miners since then.
We also saw gold go lower as well, in the range it is in.
Silver really broke down today and broke out of the range, again really not a surprise considering how weak its been acting, in fact lagging gold big time.
As we have been discussing here, we have been waiting for some sort of pull back. We have talked about why its going to be a bumpy ride up...Now we get to see next week how deep and how long. Remember too, this does NOT mean this was it for gold and gold miners.
Over the weekend we'll discuss the specifics and scenarios we could see and we'll go over other details together and prepare for the coming week.
|
|
Pillar of the Community
United States
606 Posts |
OK Yup,
I was going to order a couple boxes of kookaburras tonight, but will hold off given your analyses and this thread. I'll wait until you give the green light regarding a silver uptrend.
I'll still buy vintage bars as they don't really seem to change based on spot.
Thanks!
|
|
Pillar of the Community
United States
3361 Posts |
@AgCoinAu I'm not saying dollar cost averaging is the best investment strategy. I've just given you an example of how it worked to triple the size of an investment. Going long is an entirely different strategy than day trading. It took decades of buying on the ups and downs to build up the holdings, and it all would have been lost if they hadn't been sold before the price of oil plummeted.
Much like mining stocks, royalty trusts are in the long run zero value. They pump their wells dry. Yield and depreciation are the core of how they pay off. But they are also speculative vehicles just like metals, real estate and equities. It's the speculative traders (hunting for high yield investments over the last 8 years) that increased my dad's estate's wealth so much. And none of the royalty trusts is very big in size. I made the daily markets on a couple of them when I liquidated. They're small enough that a small investor has a say in their value.
Metals are a completely speculative vehicle without the hedges of dividends and depreciation. Unless you're on the scale of a sovereign state, you have no say in their long term pricing. Day traders can twitch the values a little but they don't control the macro trends. Just as with the underlying value of the royalty trusts - oil and gas - it all depends on what Russia, Saudi Arabia, China and the USA do with their sovereign reserves. Even a player the size of the UK dumping gold reserves can sink the price for years. You would hope that the bigger players are wise to the damage they can do. But after seeing what happened to oil you wonder.
FWIW I remember those halcyon days in 1990 when gold was $400, and I also remember that that seemed high at the time. The Breitling watch I'm wearing is a reminder of the stack of eagles I sold back then to get it. A purely discretionary investment became a tangible asset I've enjoyed ever since. Its replacement cost far exceeds those eagles even at $1200. So I don't go crackers over 52 week highs - unless I need the cash for something discretionary.
"Two minutes ago I would have sold my chances for a tired dime." Fred Astaire
Edited by thq
02/27/2016 1:28 pm
|
|
Pillar of the Community
United States
3789 Posts |
Ok lets look together at what is happening in gold and silver. As always, charts only show us the PAST. They do NOT tell us the future. We have no crystal ball, if we did, everyone and his brother would be traders and it would be easy. All financial markets are dynamic and ever changing and they are reacting every day, every hour to changing facts and circumstances. What the charts help us see is how prices have moved in the past and helps paint a picture, it is a visual aid. Also let me make myself clear. I am a TREND FOLLOWING TRADER. I follow the trend, the momentum. Trends can last days, weeks, months and years. I am looking for the TREND. Following the trend, such as buying assets at the 52 highs just as they start can be extremely profitable.The same with selling and avoiding assets at 52 lows, it can be extremely profitable to sell short assets such as stocks commodities, bonds, and currencies that start a down trend. The trend is established by the PRICE action that is the PROOF and undeniable FACT of where the institutional money from all the market participants is flowing to. Without their titanic sums of money the markets do not move. When they start moving moving their money to buy or sell, that is what I want to watch and that is again, expressed by PRICE action which never is wrong nor lies. Price action above all is what matters to me, not what I think or my opinion or the opinions of others. I have never ever been lead astray by following price. It has saved me from disaster and it has given me profits and told me when it was time to exit or that I was wrong. I present to you this information solely based on price and my experience of how price works and scenarios that exist. I can only suggest to you, based on price, what you can do. What you do is entirely up to you and at the end of the day, it is your money. I am solely offering up to you free educational information and you can decide what you wish to do. Gold 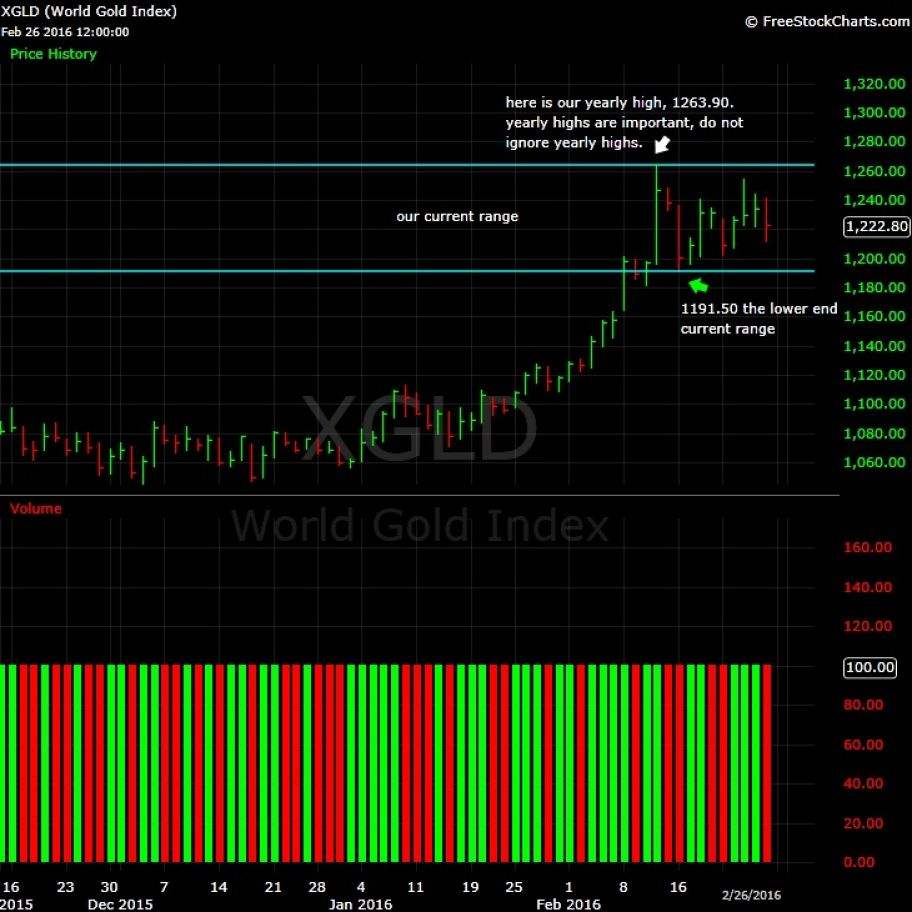 Gold hit yearly highs about a week and half ago, very important point in time and price because it tells us it is an in uptrend and just starting up. Whenever you see assets at yearly highs, it signals that market participants are and have been buying and have substantial positions in whatever asset it is that is sitting at 52 highs. In this case it is gold. Do not make the mistake to ignore any asset at yearly highs especially at the precise moment it starts hitting that yearly high. For the year, gold is roughly up 15%, compared to various stock indices and other commodities that remain in downtrends. The yearly high for gold is 1263.90. AFter gold hit that yearly high, it pulled back for a bit. On a pull back from the yearly high it went as low as 1191.50. After a few weeks we can see gold recovered from those lows but has pretty much chopped around. Clearly gold has lost some of its energy. However, this should be of no surprise, as it started breaking out in shorter time frames many weeks ago and hit yearly highs. Take a look at the chart above and we can see the clear range we are sitting in right now. We have our yearly high of 1263.90 and a lower range of 1191.50. Gold has been bouncing around here and there is nothing wrong with that. It would be better for gold to just sit around here in this range for a while and bounce around. If you are looking for higher prices, it would be best to see this sideways chop continue and then to see it break higher from this range, going beyond the yearly high. Going into Monday, let us see what happens in terms of price. A break of the Friday low, 1212, could bring us even lower prices ahead. if we break 1191.50, outside of this range, we could be setting up for even lower prices. It is entirely possible and not out of the realm of possibility to see gold try and re-test areas of where it originally tried to break out several weeks ago. Price wise, hitting yearly highs is enough to tell me that this move is not done. However, seeing that gold has been in a downtrend for several years, there are many levels ahead that will result in overhead supply for gold. In other words, there will be points in price where sellers step in and sell. Remember, price has memory. Keeping that in mind, it is clear the ride will be very bumpy. However, without a doubt, when an asset hits yearly highs, it is not done going higher. 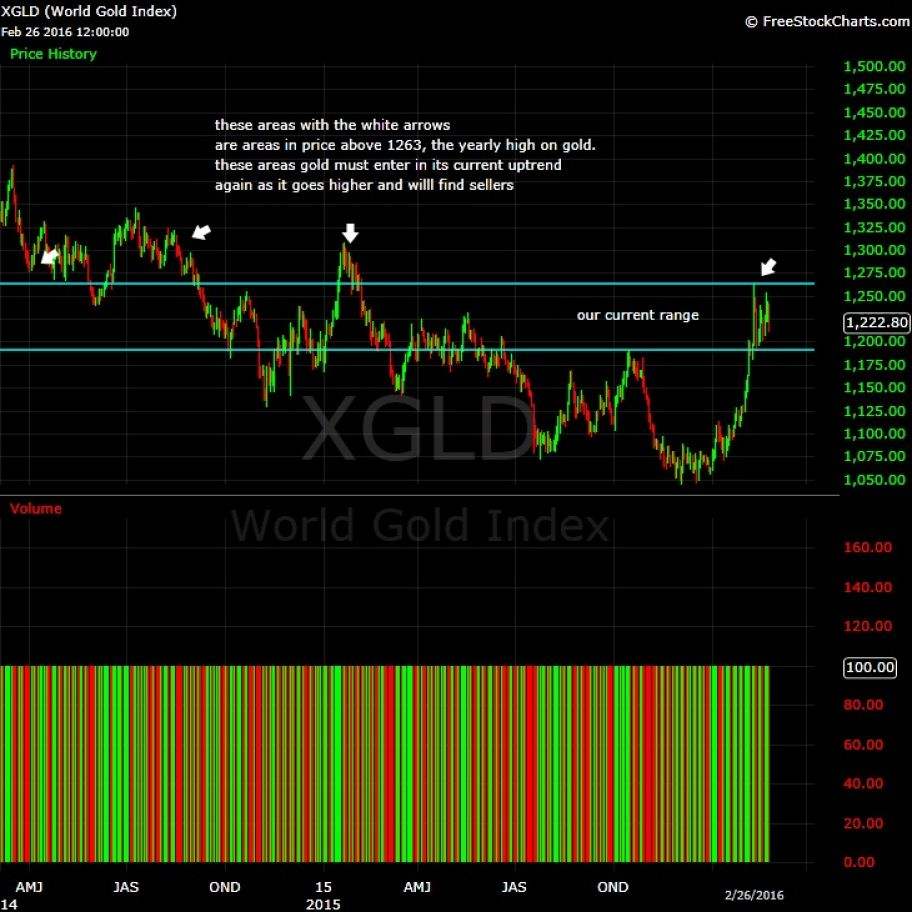 The coming week will bring us even more clues regarding where gold is heading and how soon it has a date with yearly highs again. Above, I include another chart here, going back to april 2014. The purpose of this is to demonstrate how much overhead supply, again in terms of PRICE, that gold will have to move into. These areas will find sellers. These areas are illustrated by the white arrows. Silver 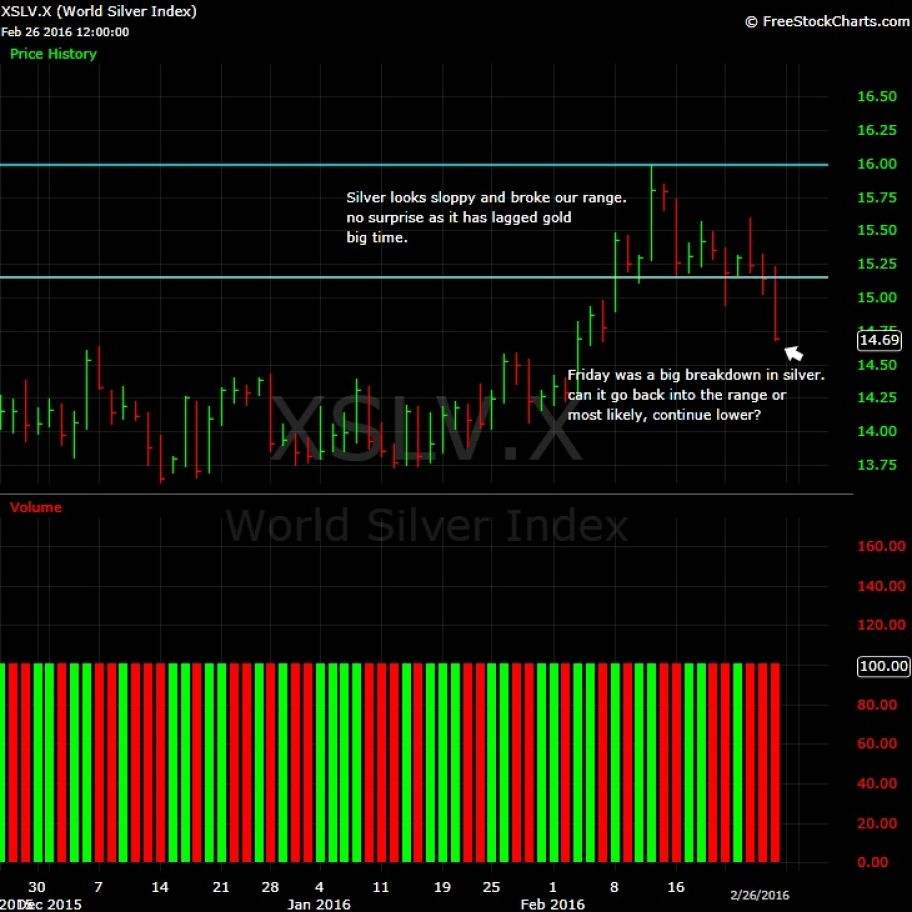 Silver has been lagging gold big time. Friday it really broke big time out of the range and appears like it will go even lower unless it can manage to get back into the range, tho the probabilities are leaning in the direction of much lower prices. In any case, silver looks sloppy and weak and has not been a leader like gold, it hasnt even hit yearly highs. Despite such sloppy price action, silver is up this year, sitting at 6% year to date. Take a look at this chart to see how on this Friday, 2/26/16, it broke the range we had. Usually when a range is broken, the direction it breaks tell us where price is headed. In this case, the probabilities remain high that silver goes lower from here. In fact, just the mere fact that it closed the low of day on Friday at its lows foreshadows even more weakness ahead. In some aspects, this is not surprising, as the price action in silver has greatly lagged gold, which has hit yearly highs, unlike silver. Lets see how lower silver goes from here. With the sloppy price action it is going to take some time to see exactly what silver wants to do and from where it wants to bounce from. Clearly a pull back is in the works in the metals and miners. Let us talk gold miners briefly. We mentioned last week the impact of a down grade coming in as a stock makes 52 highs and as I had mentioned about prices coming in lower, thats exactly what happened with GOLD, (Randgold Resources) as it was hit with a DG and continued to go lower. I have seen this pattern many many many times before. Most of the times when it happens with a stock at 52 highs, what it means is that a lull or pull back in price in the stock and then after some time, it comes right back to its 52 highs and continues higher. I have traded and been in this same situation many times in other market leading stocks as they hit yearly highs, AAPL, TSLA, GOOG and other names come to mind and countless less other stocks, commodities etc in years past. The scenario again is: A downgrade comes in after the stock has been running hot and hitting yearly highs. Then, everyone comes out of the wood work saying how this sector was "over extended" or "too high priced" , terms which mean NOTHING to traders. We simply see price pulling back and we are observing how deep the pull back is and where it starts moving again. In the meantime, you start getting all these wild estimates of how low this stock is going (short this stock its going to 60 now or some crazy number they pull out of no where), how this was all a head fake and all sorts of meaningless opinions, which I might add, again, mean nothing and are wrong. Folks, yearly highs mean something and you should pay attention if you are on the buy side. Anyone who tells you to ignore 52 highs or that they dont mean anything just is someone who is very inexperienced and doesn't know what they are talking about. Sadly, by the time most people notice how high an asset is and jump onboard, it is too late, as they ignored the 52 highs and ignored when it started its first entry into 52 highs. Finally, remember we talked about "the Trifecta" which was, besides gold, the Japanese yen and the US Long bond note, the 20 year. Those two have also weakened up as of late in terms of price. Again, the patterns they are exhibiting, again all based on price, are where they hit yearly highs, pull back, go into a lull and then after some time, are back again at yearly highs. Up trends work in this manner. Sometimes the uptrend is relentless buying with very few dips and pull backs. Sometimes an asset hits yearly highs, pulls back, goes into a lull, and then after sometime, hits yearly highs again, and the pattern repeats itself, over and over. More clues are coming up next week so hang tight and allow price to tell what you what is going on. Edited by yup7676
02/29/2016 01:53 am
|
|
Valued Member
United States
194 Posts |
|
|
Pillar of the Community
United States
3789 Posts |
Monday brings us a rebound on a shorter time frame for gold. No higher high over the Friday close, however no lower low over the Friday close either. So for now, just a bounce, look to see if tomorrow gold can close over the high of today, which was 1236.80
Silver, as we said did manage to go lower than its Friday close but ended the day on a high note, going out on its HOD. It did not, however, go over its Friday high of day. Look to see if silver is going to get back into the range this week. Look to see if silver can get back over the HOD (high of day) of today which was 14.91
The miners, after pulling back last week found buying today (no surprise really) and we had several names again at 52 highs. Sounds familiar huh... you might recall I have repeated that once an industry group of stocks starts hitting 52 highs, and they are making yearly highs, this will happen over and over.
Today we had 4 miners at 52 highs, tho a couple names are pretty pathetic miners but the main takeaway is that buyers are in control of the gold mining stocks, the industry group is strong and the trend is strong... all of which is being related to us via price. Today we had AU,GSS, HMY and SBGL at the 52 high list.
Our favorite proxy, GOLD, bounced today after last weeks downgrade and made, on a shorter time frame made a higher high and higher low. If it continues this pattern, it will be hitting yearly highs again.
Again, I think the pattern that is starting to emerge from the gold miners and gold will be one of making yearly highs, followed by a pull back and lull and back again to yearly highs,,, rinse and repeat. To also repeat- these pull backs do not affect the uptrend, it is still in place.
Until these yearly highs stop and trend lines are broken, this uptrend is here to stay and the buyers remain in control. We will be looking to see if this happens but again, with trends, they follow the path of least resistance, which for now with gold, is up.
So there you have it, the market is buying gold miners and I suspect if this pattern continues with gold, we'll be seeing another date with yearly highs.
|
|
Pillar of the Community
United States
3789 Posts |
lets get up to speed here-
Gold has been choppy, with quite a bit of chop. Not really a bad thing. For the most part we can see its been avoiding getting into, in a shorter time frame, a series of lower highs and lower lows which would set it up to go lower.
instead, progressively, day by day, the chop has resolved higher. Should this continue, breaking the yearly highs again is a possibility.
In any case, gold remains in its uptrend and the price action remains healthy.
Silver remains the laggard. However, after breaking down out of the range 2/26, for this week, we can see it is back in the range again. Perhaps we just saw a failed break down, where sellers did just not have enough in the tank to keep selling.
So while silver is greatly lagging gold, it did manage to get into the range again and we can see it is now hitting and making a series of higher highs with higher lows, which in the context of a shorter time frame indicate it wants to move higher into the range.
Our proxy GOLD- still looks good price wise. It has also chopped around, touched the lower end of its range but remains in the range and is moving up. It remains in its uptrend.
GDX, the gold miner ETF looks like it is set to break out higher in the coming days and out of its range as well.
As we had been talking in the past few weeks, gold and gold miners would have a bumpy run here, with pull backs and side ways action. That is what we are seeing thus far. Gold and gold miners remain in up trends and we continue to watch and see when they next hit their yearly highs.
|
|
Pillar of the Community
United States
3789 Posts |
well, gold came within roughly 2pts of hitting that yearly high.........
|
|
Pillar of the Community
United States
7390 Posts |
Thanks for your wisdom yup. Now that I'm seeing a broken downtrend in action I know how to act in the future. I just need to learn the ins and outs of trading. I did however add another couple ounces of physical gold last week. Wish I would have bought more than 1oz at $1075 but I see your point on buying in an uptrend at a higher price rather than a lower price in a downtrend  Edited by Cascade
03/03/2016 1:51 pm
|
|
Pillar of the Community
United States
3789 Posts |
Gold has hit fresh 52 highs... again
Can you say uptrend? This is why we follow price action. This why we pay attention when an asset hits a 52 high or 52 lows. WE do NOT dismiss yearly highs or lows. They are important to traders of ALL time frames but most importantly, LONG TERM TREND TRADERS, caps for emphasis, pay attention to 52 highs and 52 lows because they go on for a while, not just a matter of days.
big move in gold today. Miners moving out and breaking out as well and our proxy, GOLD also moving,
very strong gold buying across the board in the final hour of trade.
as I have mentioned, we want to follow the price action, we want to follow the TREND. We want to pay attention to both YEARLY HIGHS and YEARLY LOWS. We want to be right when a year highly starts and sell short at yearly lows.
Do not make the mistake of ignoring the trend, the yearly highs or yearly lows, in other words, always look at price as your guide.
We can make a lot of money following trends AND also limit our losses and risk by following price action. IF we are right we are right by price and if we are wrong, we are wrong, price saves us from STAYING wrong.
Edited by yup7676
03/03/2016 3:33 pm
|
| |
Replies: 5,661 / Views: 465,196 |
To participate in the forum you must log in or register.
Disclaimer: While a tremendous amount of effort goes into ensuring the accuracy of the information contained in this site, Coin Community assumes no liability for errors. Copyright 2005 - 2026 Coin Community Family- all rights reserved worldwide. Use of any images or content on this website without prior written permission of Coin Community or the original lender is strictly prohibited.
Contact Us | Advertise Here | Privacy Policy / Terms of Use
|
| Coin Community Forum |
© 2005 - 2026 Coin Community Forums |
| It took 0.75 seconds to rattle this change. |
 |
|
| |
| |







 First Page
 Previous Page


 Posted 02/26/2016 4:35 pm


