Coin Community Family of Web Sites Join Thousands of Coin, Bullion, & Money Collectors
Royal Canadian Mint products, Canadian, Polish, American, and world coins and banknotes. Vancouvers #1 Coin and Paper Money Dealer Specializing in Modern Numismatics Royal Estate Auctions - $1 Coin Auctions300,000 items to help build your collection! Join Thousands of Coin, Bullion, & Money Collectors Coin, Banknote and Medal Collectors's Online Mall


Username:
Password:
Save Password
Forgot your Password?


This page may contain links that result in small commissions to keep this free site up and running.

Welcome Guest! Registering and/or logging in will remove the anchor (bottom) ads. It's Free!

What Happens To Gold And Silver Next? Look Out Below?

To participate in the forum you must log in or register.
Author Previous TopicReplies: 5,649 / Views: 460,960Next Topic
Page: of 377
Pillar of the Community
silverwolf's Avatar
Canada
3733 Posts
 Posted 05/19/2016  8:57 pm  Show Profile   Bookmark this reply Add silverwolf to your friends list Get a Link to this Reply
glad to see "yup" is holding steady, so how should everyone who bought in at 18.60 that you recommended feel. now you are saying just ride it out.. sit still and wait..so why is it not a good time to double down with the depressed price..you always say never double down..i think perhaps , with the price action, which is always right...silver is going to test lower..so..?i'll let you fill in the blanks, there are a lot of people who buy with your guidance, so where to we go from here..//
Valued Member
United States
455 Posts
 Posted 05/19/2016  10:30 pm  Show Profile   Bookmark this reply Add Webekin to your friends list Get a Link to this Reply
My cost basis was $15.58, then made another purchase now we are at $15.91. The next purchase should move us into, $16.xx, still acceptable when silver should move on up!Webekin
Pillar of the Community
MontanaCMR's Avatar
United States
606 Posts
 Posted 05/19/2016  10:42 pm  Show Profile   Bookmark this reply Add MontanaCMR to your friends list Get a Link to this Reply
@wolf,

Did Yup recommend buying at $18.60?
Pillar of the Community
MontanaCMR's Avatar
United States
606 Posts
 Posted 05/19/2016  10:55 pm  Show Profile   Bookmark this reply Add MontanaCMR to your friends list Get a Link to this Reply
I do see an earlier post that says to properly buy gold:

Buy at $1263, $1263, $1280, and $1287.

It's $1255 and I suppose under water.

Not criticizing because it's as good as guess as any other.
Valued Member
Whitetail Junkie's Avatar
Canada
312 Posts
 Posted 05/20/2016  03:13 am  Show Profile   Bookmark this reply Add Whitetail Junkie to your friends list Get a Link to this Reply
Do you guys think with PMs on the rise the last little bit,we are in for another economic crash like in 2008 but worse?

Valued Member
United States
154 Posts
 Posted 05/20/2016  09:55 am  Show Profile   Bookmark this reply Add zack6736 to your friends list Get a Link to this Reply
yup has also said to have patience. The stock market is not a get rich quick game, at least not for the ordinary folks. How do you think the rich get richer? They buy, and wait, then when ordinary folks get nervous and bail, the rich reap the profits. The PM and miners are in an uptrend, just look at the charts, but there will be dips, this was a heckuva dip I grant you and I didn't like it. My miners went down near $1500, but feel confident it will come back. As for my physical silver, it didn't loose a cent! It's sitting right where I left it, waiting patiently for the next bubble to burst which I believe will be the fiat currencies, then anyone holding silver or gold will be thanking their lucky stars they had metal instead of paper. I for one would like to thank yup for the time and effort he puts forth to try and help those members here that follow this thread. "Thanks Mr. Yup!" He has also said to be patient. An uptrend can last for years. I'm holding onto my miners stock, then plan on flipping it into metal once I feel the miners have topped out, or when I feel I can buy the maximum amount of metal from the miners cash out. The stock markets history has been a large correction, or crash if you like, every 5 years or so. We are now 7 years since the last "correction". Be patient.
Valued Member
United States
51 Posts
 Posted 05/20/2016  10:34 am  Show Profile   Bookmark this reply Add mycoguy to your friends list Get a Link to this Reply
Thanks YUP..we all appreciate you taking the time for your input and analysis.
Pillar of the Community
United States
3789 Posts
 Posted 05/20/2016  12:03 pm  Show Profile   Bookmark this reply Add yup7676 to your friends list Get a Link to this Reply
First up-

If we break these numbers today, probabilities are high that it sets up for more selling into next week..

Silver- breaks yesterday LOD- 16.35

gold- breaks yesterday LOD - 1244.60

Miners had good reversals yesterday, those were the dip buyers nibbling, not surprising that we are seeing them reverse today.

IF you go back and read this thread, you will see we have repeated many things, over and over and over. If you cant retain those things after so much repetition, then probably you are missing the whole point and basics of price action, patterns and the fact that markets are dynamic, always changing.

We have clear confirmation by price that silver and gold are in uptrends. The uptrend just doesn't die after its started.

We have a TON of overhead supply, as expressed by price, that gold and silver have to get past on the way up. No surprise here. Any asset on the way up and on the way down does this at certain levels.

We want to ALWAYS buy assets in uptrends and either sell, sell short or avoid assets in downtrends.

When we buy, we want to buy right. We want to be there at the start of the move. When we do start buying, we dont bet the farm, we dont bet mom and dad, we dont bet the house. We start legging up in portions. We dont start being egregious and start buying every single dip in an uptrend and we dont buy every single 52 high, just because its in an uptrend.

Let's say silver and gold go lower from here. If they do, it doesn't mean the trend is done. If you have profits and are worried you are going to lose them and dont think they are going up, then sell and book your profits. If you bought silver at the break of the trendlines back in the 16s and you cant handle the pattern, then stop buying and sell what you have.

If you bought at the first yearly highs for gold and silver and cant handle this pull back, then sell. You cannot will the market or demand from the market anything. You must learn to observe the tape and learn the behavior and price action.
Pillar of the Community
United States
3789 Posts
 Posted 05/21/2016  8:16 pm  Show Profile   Bookmark this reply Add yup7676 to your friends list Get a Link to this Reply
Ok, lets look a few things and I'd like to share a few thoughts

Gold-

What-Happens-To-Gold-And-Silver-Next?-Look-Out-Below?

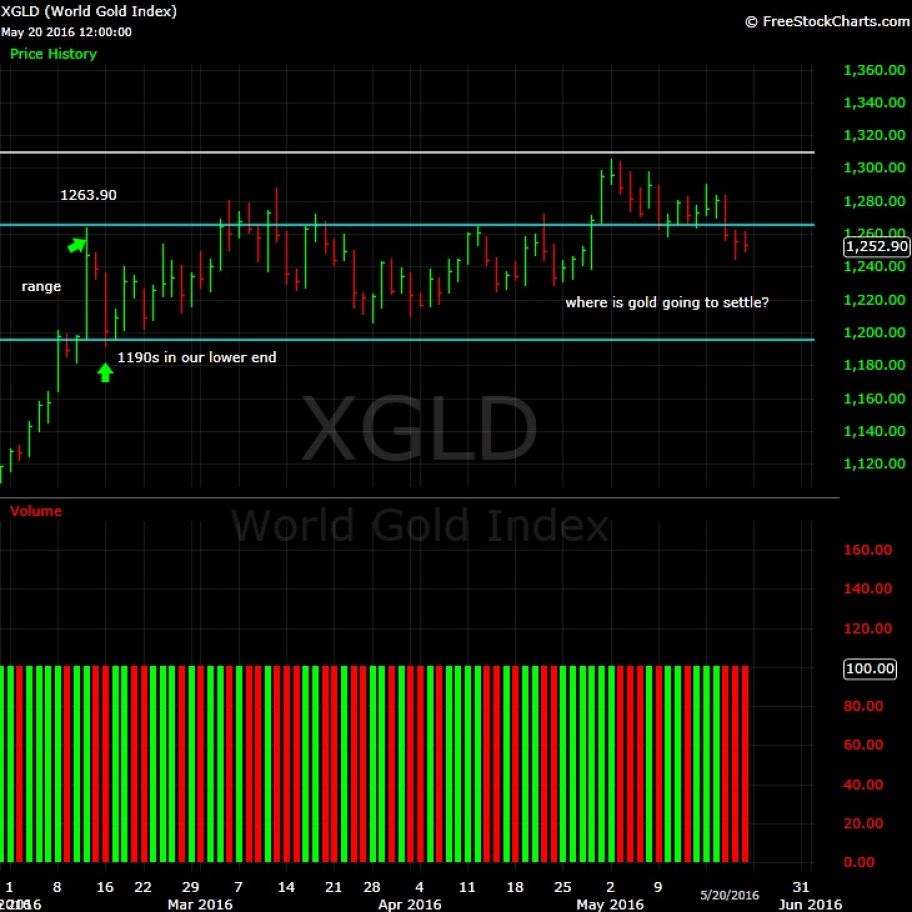
We saw gold hit 1306 on 5/2, that was the most recent yearly high. Since then, gold has manged to form a range, chop around and then this week, dropped out of the range.


Those 1260s didnt hold despite a few bounces from there. You might recall that from 2/11/16, that was one of our early 52 high break out points. Gold did attempt a few times this week to reach that area but could not settle there.

For next week, we want to observe two things-

1- can gold be bought up back into that range above the 1260s?

2- Can gold put in a series of steady higher highs and higher lows instead of lower highs and lower lows next week?

Failure to get back into the range and make lower highs and lows would put gold into a lower range. However, we cannot rush to judgement and say that is what happens next week. Let price show us what happens, do not react first. Either the buyers show up and push it back into that range or they dont, simple as that.

I want to stress again, let the market do what it wants to do. Do not go into next week with your mind filled with thoughts that this is what will happen. Just follow price.

Watch and see if 1249.60 holds for next week. If it slices through there, see how price reacts. Conversely, look to see if gold can get over the Friday high of day, which is 1261.20, those are the key numbers to watch to start the week.

In the chart I have zoomed out a bit to show our first big range we saw gold develop. We can see over two months, despite breaking out to 52 highs after 2/11, gold had some deep pull backs and then a lot of chop and nothing. Should be no surprise then that then some folks would get their panties in a bunch with a drop last week after weeks of nothing going on.


Silver

What-Happens-To-Gold-And-Silver-Next?-Look-Out-Below?

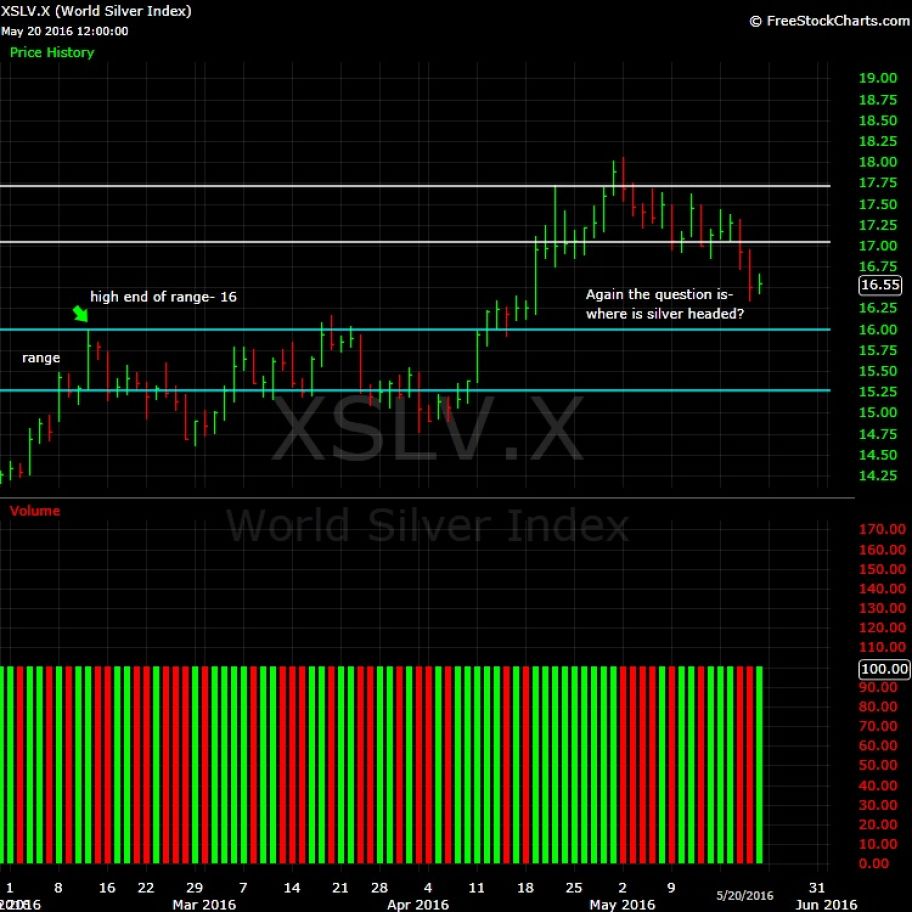
Same thing here as gold. Again to recap- We had that range of 16 broken that lasted for 2 months that resulted in a very explosive move of nonstop buying. The first yearly high was made on 4/29, 17.78 and a proper buy point. Notice how we made another 52 high and from there we have seen silver form a range and break lower.

We have seen this before, where silver broke the range of 16 to the downside and then found buying. It did this repeatedly and found buyers each time.

Its very simple, just as with gold, either buyers step in or they dont. Same principles apply here, higher highs and higher lows will get price higher and back into the range whereas lower highs and lower lows will result in lower prices. Dont over think this and solely pay attention to price.

At some point the buyers will step in. Dont rush ahead of yourself and just say "oh yea, this is done". If you have been buying at 16s you still have a comfortable cushion. If you bought the first yearly high of 17.78 you are below it but that is a proper buy point. We will discuss later a bit about these 52 high b/o points.

The number to watch for next is first if silver drops below the Friday low of day, which was 16.43 and pay attention to the Friday high of day, which was 16.67.

Let us talk briefly trends, patterns. I really cant go into every single detail for many reasons but all trends, patterns are dictated first by the asset. Each asset has its unique personality. Each asset reacts according where it it is in price and where its at.

Some assets, such as gold and silver, must deal with overhead supply. Remember, price has memory. I have repeated this many times, the simple fact that areas will have sellers and buyers.

Also remember market conditions are important to how an asset works. SOMETIMES, assets can break out to yearly highs but if market conditions are not ideal, break outs and break downs will not work or just not ready to go. The only element that helps things along is time and time alone.

Let us circle back to 52 high b/o (break outs). Some 52 high break outs act-

1- in a steady grind up, where buyers buy up every single dip and a 52 high is hit

2- some 52 highs breakout, then falter, pull back very deeply in price and then months later run back up

3- some 52 highs are violent, with major run ups and then collapse completely and again, these are determined by the asset. Some biotechs fall into this category. Some fast running tech company IPOs fall into also, as an example and other stocks do this pattern.

AGain, each and every single asset has a unique pattern and personality. Let me show you some examples-

AMZN

What-Happens-To-Gold-And-Silver-Next?-Look-Out-Below?


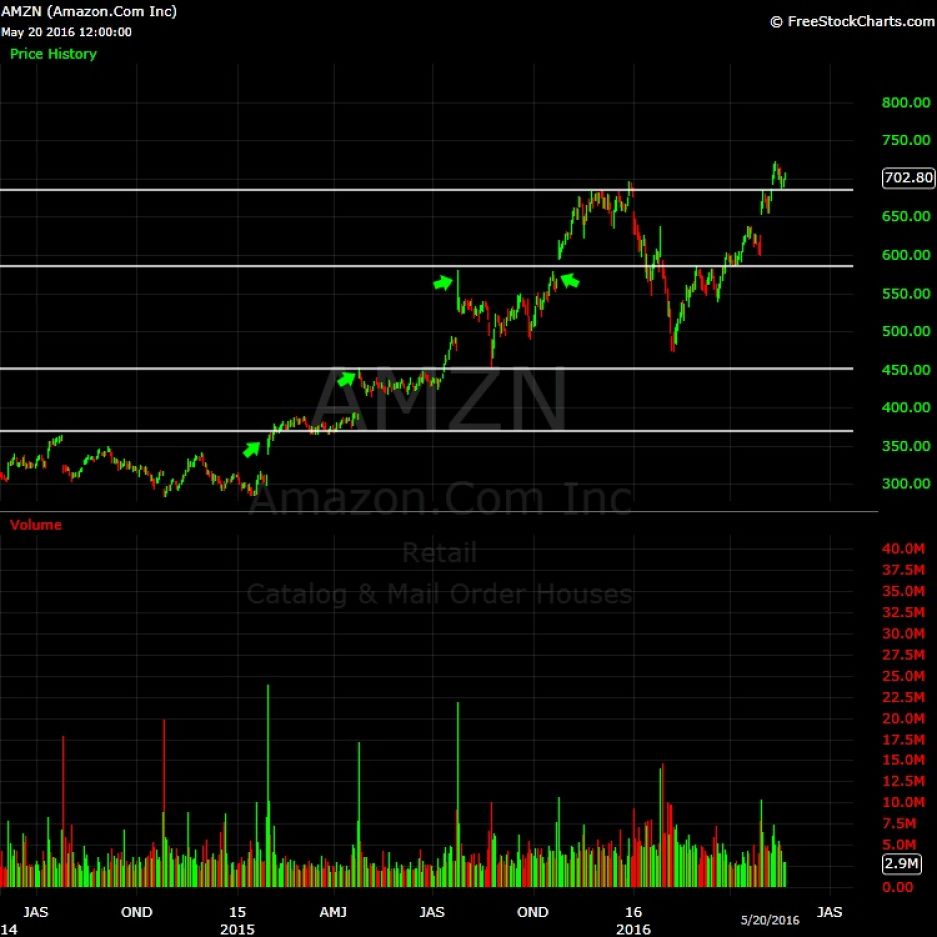
Take a look at this chart. From June 2014, Amazon.com has continued to break out to 52 highs. Overall, a very strong uptrend but with violent deep pull backs. But each and every single time, it has consolidated those pull backs and raced higher (52 high break outs b/o indicated by the green arrows). You can see how profitable it has been able to play the 52 high b/o if you wanted to just play the b/o and then dump it. In other cases, if you were holding and adding, you are sitting on some major profits.

IF you bought right, added on the way up and then stopped adding, you are up big. This chart only shows to mid 2014, AMZN has been running for many years. The power of the trend and buying 52 highs is clear to see here, with DEEP violent pull backs.


GPRO


What-Happens-To-Gold-And-Silver-Next?-Look-Out-Below?


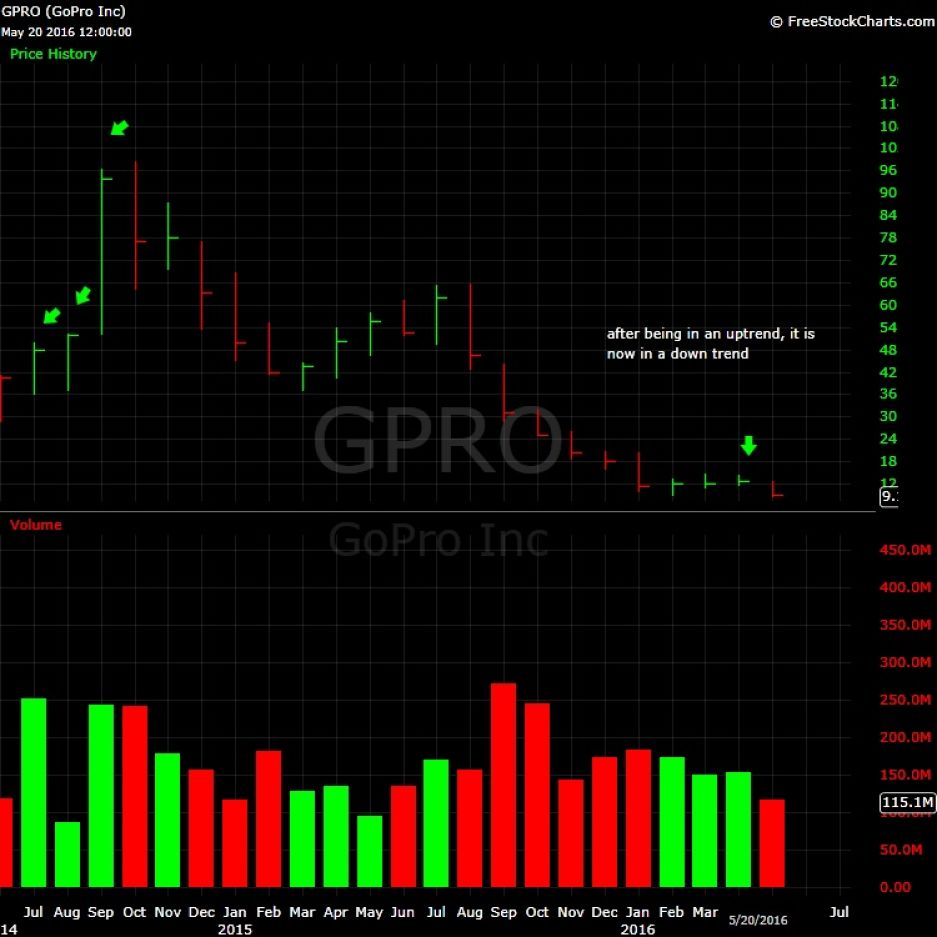
Here is an interesting pattern of an uptrend that experienced rapid buying early at the start of the IPO and then 2 years later, fizzled out. Notice where the green arrows to the left, month after month of buying, relentless buying that eventually stopped. In this type of pattern, the rapid, nonstop buying resulted in the stock losing its uptrend and entering its current downtrend.


Sugar ETF

What-Happens-To-Gold-And-Silver-Next?-Look-Out-Below?


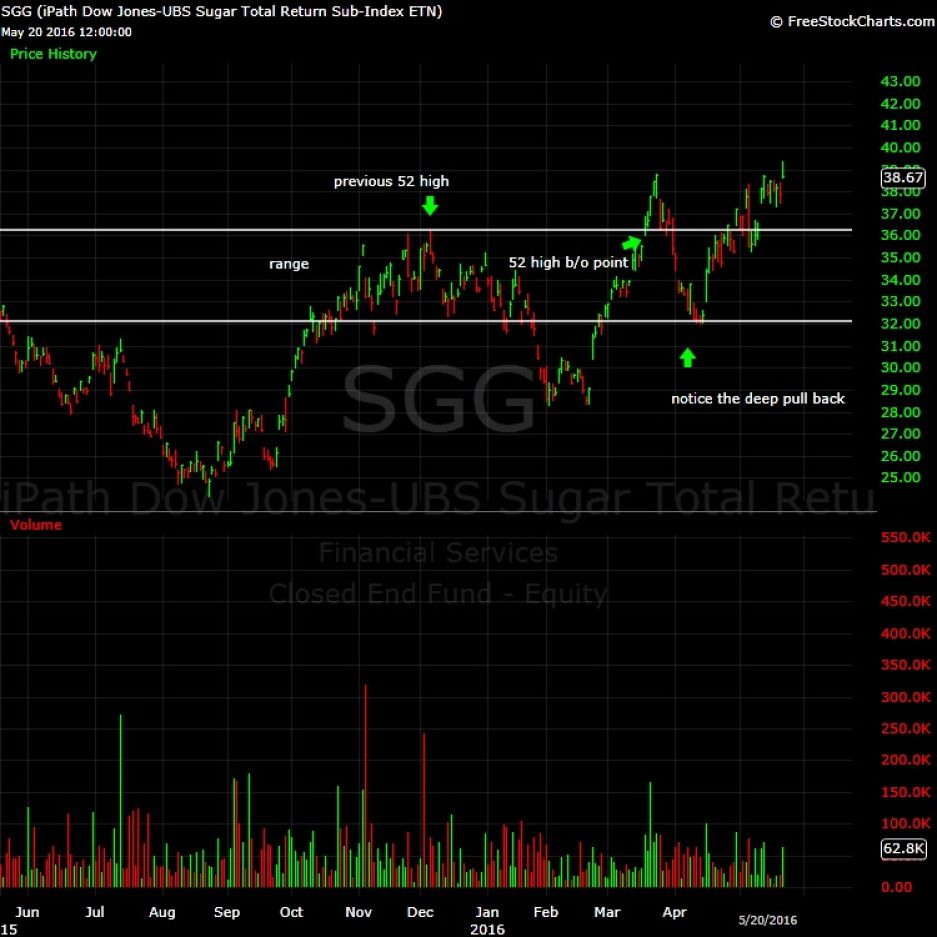
Yet another commodity, as expressed in an ETF, I am using it solely to demonstrate price action. Notice that a 52 high break out occurred and then sugar then collapsed hard, retraced beyond its break out point but then after several months, as of Friday, made yet another FRESH yearly high. Notice that it bounced from a range and then it was off to the races again.

FNV

What-Happens-To-Gold-And-Silver-Next?-Look-Out-Below?

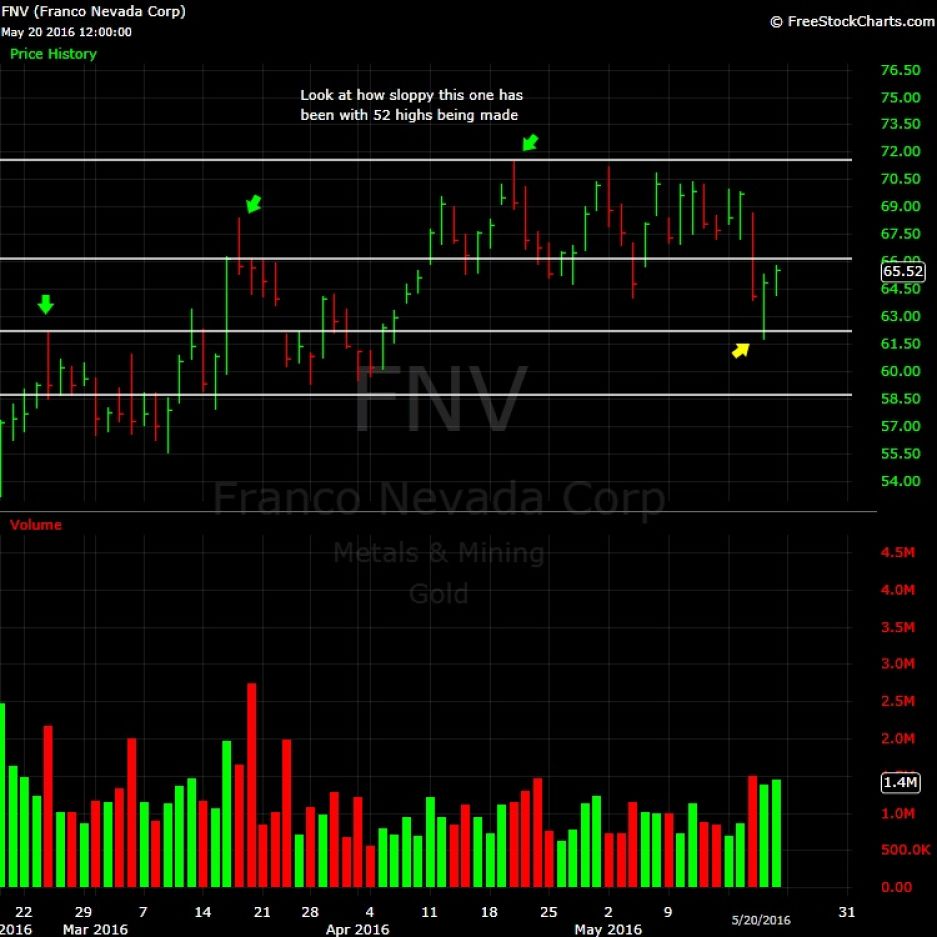
Take a look here. Look at the green arrows, all 52 high b/o points. This miner is in an uptrend. The earnings reaction was positive. Yet on Thursday (noted by yellow arrow), it dropped, retraced ALL of its gains going back to 2/24, where then it staged a very strong reversal and is in the process of putting in a series of higher highs and higher lows. In this pattern, the buyers said enough is enough and stepped in at a break out, illustrating our point that price has memory, in this case buyers showed up,, you guessed it, in an area where FNV had broken out.

The 52 highs have been sloppy and ugly. It is still there, hanging in to fight to stay in its uptrend.

So what is the point in these charts. It is illustrate that

1- all assets have unique characteristics to them

2- some have super sharp pull backs but it does NOT negate the uptrend

3- It is normal to see a break out tested and go lower from the first 52 high break out area and in some cases where a trend line is broken.

For this reason I highly stress to not get ahead of yourself and get all in a huff because a pull back happens in an uptrend. Allow it to play out. Manage the risk, the dont jump ahead.

Should we pull back more, you can either-

1- if you have profits, take them off the table if you dont want to go with the deep pull back

2- if you are down from buying the 52 high b/o, you can either stop out now or use a percentage stop. I would not go more than 10%, as an example.

Tiring as it may seem, I will say it again- Remember how I was saying in this thread, that when you buy, buy at the start of the 52 high or break of the range. Leg into it. I know some of you want to double down, so to speak. However, if you do that, in a uptrend, you can find that one time you do it, is when you get shook up.

You must balance your position size with the asset you are putting money into along with your emotions. If you are buying far from the 52 high b/o and putting in a lot of money, its going to be very hard to handle the emotions of "is this uptrend done?" "oh god, I am underwater by X amount" to "hey, I thought this was in an uptrend, I cant stand this, its going down".... it is going to play tricks with you.


Anyways, let next week come, go with the flow and lets take each day by day and not rush to judgement. If this trend is going to go dormant and do nothing for awhile, thats OK. However, I want to stress again and again and AGAIN that some uptrends, especially when there is overhead supply, will be very supply. In the case of gold, silver and sugar, that is very TRUE.






Pillar of the Community
ilikeikes's Avatar
United States
1205 Posts
 Posted 05/22/2016  11:47 am  Show Profile   Bookmark this reply Add ilikeikes to your friends list Get a Link to this Reply
awesome work there YUP..thank you so much for putting the time and energy into helping us all out in this interesting time.
I see your GOPRO chart..I'm sitting on a 85% loss..no reason the sell, as I have mentally written this one off..if it goes up, fine...maybe sometime down the road, it will take me to "just" a 50% loss.
1 chart you should show is AMBA..ambarella. I made my first big profit off them last May. The 1 day drop was incredible...if I had had phone alerts, I could have saved 5k in profits..I did walk away doing very, very well. My point is how fast things went south in just like 2 hours..it was a classic stock dive after months of running up.
http://www.nasdaq.com/symbol/amba/i...active-chart
Pillar of the Community
MontanaCMR's Avatar
United States
606 Posts
 Posted 05/22/2016  5:35 pm  Show Profile   Bookmark this reply Add MontanaCMR to your friends list Get a Link to this Reply
in the last post, you describe options for potentially exiting. If prices drop next week, is the uptrend over based on your data? I was hoping we were just getting started.

Also, these ranges are starting to see a bit arbitrary.
Pillar of the Community
United States
3789 Posts
 Posted 05/22/2016  6:06 pm  Show Profile   Bookmark this reply Add yup7676 to your friends list Get a Link to this Reply
@MontanaCMR

No, even if we drop lower this week, no the uptrend is not dead. A trend doesn't just start and then roll over, it takes time. Everything in the markets is a process,,, a process to start, a process to end and all of that takes time.

Now, if gold has raced like speeding race car and ran from say 1263 to 1600 in 2 months, I would be like whoa, better protect profits here now.

If anything, I would not be surprised that silver, gold go dormant. Does that happen soon? I dont know, first we watch level by level, the price action will give us clues as it has every single time.

Pillar of the Community
United States
3789 Posts
 Posted 05/22/2016  6:55 pm  Show Profile   Bookmark this reply Add yup7676 to your friends list Get a Link to this Reply
@ilikeikes

yea AMBA is another one, I never personally traded it but it had a great run for 2 years and like gpro, started to just slow down.

The biotech IPOs from the past 5 years were the same thing. You could buy a line in some, the 52 high b/o were beautiful, dump them, buy them again at the 52 high b/o, dump them etc.

Eventually many, if not most of these, died and now sit at 52 highs. Rapid runs and then faltering. I traded all these, in fact a big theme of the past 5 years or more alone has been IPO stocks that simply broke out higher until they were exhausted then kicked to the side. Other names that I traded that had these same patterns were SHAK, FIT, KEYS, etc.

In the case of gold and silver, this pattern really isn't there.

The thing that makes trend following and trading/investing hard in this market is that we have lost our momentum. The market has been bipolar since November of 2014.

One week, things are up. Next week down. That gives us a trendless market.

In the case of gold and silver, its been one of the places where a trend has shown itself, even if its been at some times very ugly and choppy. But that doesn't surprise me considering all the overhead supply from the previous uptrend. breaking the 4+ year downtrend in the PMs is a BIG deal.
Pillar of the Community
Cascade's Avatar
United States
7390 Posts
 Posted 05/22/2016  7:33 pm  Show Profile   Bookmark this reply Add Cascade to your friends list Get a Link to this Reply

Quote:
breaking the 4+ year downtrend in the PMs is a BIG deal.


Seriously! You were a curmudgeon for EVER yup. Until one day a few months ago you actually started buying
Pillar of the Community
United States
3789 Posts
 Posted 05/22/2016  7:50 pm  Show Profile   Bookmark this reply Add yup7676 to your friends list Get a Link to this Reply
@cascade

well duh! I mean I have never ever made money by buying an asset at yearly lows, whether it was a stock, bond, etc. I mean maybe other folks dont mind but my thing is- I can buy an asset thats going up and make money versus watching it go down or do nothing.

Breaking the 4 year downtrend is a major deal. I mean it really is. The buyers did NOT come all this way just to sit back and say "oh ok now we roll over" Heck no. Now, it doesn't mean this is a rocket ship back to the moon.

I think sometimes folks(not all) get really their knickers twisted, to put it mildly since this a family friendly forum and assume that "hey this isn't going up up up up"... thing is, sometimes they do, if there is no overhead resistance AND sometimes you dont want that, as it encourages a trend to get exhausted super fast in terms of price.

  Previous TopicReplies: 5,649 / Views: 460,960Next Topic
Page: of 377

To participate in the forum you must log in or register.


Disclaimer: While a tremendous amount of effort goes into ensuring the accuracy of the information contained in this site, Coin Community assumes no liability for errors. Copyright 2005 - 2026 Coin Community Family- all rights reserved worldwide. Use of any images or content on this website without prior written permission of Coin Community or the original lender is strictly prohibited.
Contact Us  |  Advertise Here  |  Privacy Policy / Terms of Use

Coin Community Forum © 2005 - 2026 Coin Community Forums
It took 0.65 seconds to rattle this change. Forums
