Ok lets dig into this-
Depending on your time frame with gold and silver, one could say this is a great time to buy and go long, for the long haul while others that trade this have had a field day with the intra-day volatility.
One thing is clear- gold and silver are still in long term downtrends. Nothing, at all, for weeks nor months, changed. We can even see that in the past couple weeks, silver is again threatening to break down. Gold, while it has had some rips to the upside, continues to face a ton of overhead supply in terms of price.
The other factor creeping into the market now is how volatile it has become, the SPX (also known as the S and P) has really been all over the place, rudderless as some say. This has given a bit a "boost" to gold as it sometimes bounces higher on these days where the market dips. But even then, gold has not rocketed higher or made any advance.
just a quick glance at price action and everyone can easily see silver is worse off and weaker. Gold looks "better" but there is a lot of price action it must contend with to get and stay higher.
Another point I want to highlight is this- if we are going to see these metals snap this downtrend, and they could, they can,... we have to see them break out of these ranges and then hold above them and continue to move higher. We cant have this price action where they cant hold their advances.
Remember then, that TIME is a major element here. No one has a crystal, charts only tell us the past but not the future. However, using the element of time and observing price, we can see how gold and silver deal with these levels. Knocking out levels, one by one, on the way up, or not holding levels and reverting lower, will give us major clues.
ok lets get into silver first and we'll do that by using our proxy, SLV.
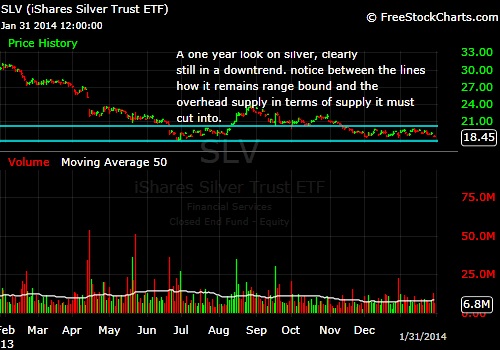
Ok the first chart of SLV, just want to illustrate the point that we are still in a downtrend. Nothing in that price action is saying prices are rising. You can also see that silver, to go higher, MUST go through those price levels. Price has memory and therefore as silver moves higher it will run into selling that could/can stop it dead in its tracks. ALL assets, whether they are a commodity, stock, bond, currency deal with such issues. It will take a ton of heavy volume, repeated buying to get silver back to even yearly highs.
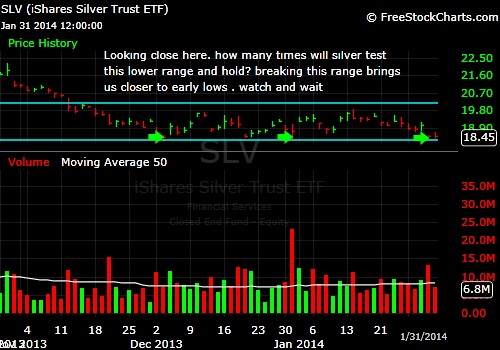
Ok, the second chart shows us how weak silver is. First we can see in the past few weeks its stuck in this range. Several times it makes the lower end, bounces, hits the top of the range, and goes lower.
It has bounced each time. Will a 4th time be different? If it bounces, how high will the next bounce be? All these questions will be answered by being patient and watching. If tho the bounces become shorter and it proceeds to hit the lower range, the higher chance that it goes below it and comes closer at that point to its yearly lows.
Again, lets wait and watch, we will get our clues.
Ok so now we turn to gold with our proxy, GLD.
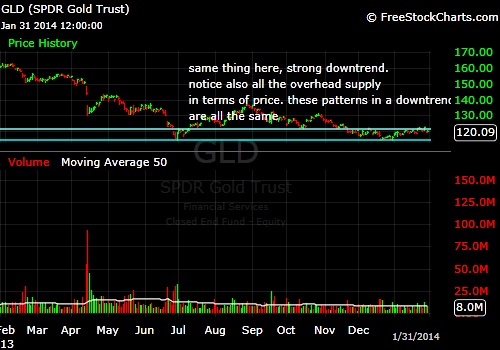
First chart up and same thing as in silver, Longer term time frame, we can see we are still in a downtrend. Nothing has changed.
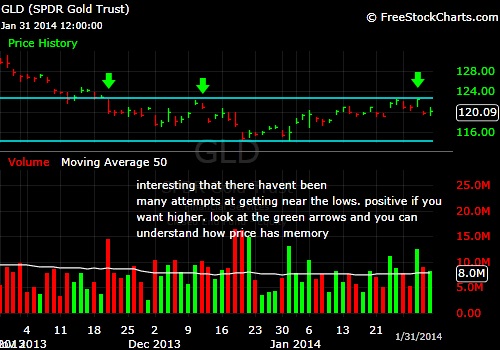
Looking closer however we see a few things. First let me make mention how there arent many repeated attempts at the lower end of the range here. You can see since it made that low on 12/31 that with each successive bounce, gold has staged higher highs, for three times, before going lower last week. Point I want to make here is you can see how in a shorter time frame that higher highs (terms of price) leave a footprint of higher prices, and these you spot by looking and observing the daily pricemovements, which all add up.
The other point is about price has memory. Yes, this works on the way up, as buyers will step in to buy, and on the way down, as buyers step in and sell. In the case of the green arrows, this is an area where in the past buyers were sellers of gold, therefore this area is now resistance to the upside.
Can we break this area? we most certainly can if there are enough buyers, that would lead to this area being challenged and,,, as you have seen, the more an area is probed, in either direction, the more chances, the higher odds of that range being broken. So keep an eye on this area as well.
So gold looks constructive here in terms of its short term price action. Now we need to see if it continues on with this same pattern or does it roll over and give up?
So we have a lot to look at going forward. Does silver hold up here? Does it challenge the yearly lows again? Is gold going to keep pushing higher from here or roll over.
Does all this mean that prices are finally going down? Downtrend done and over with? Theres many possiblities. I would rather wait and see the longer term downtrend be snapped before saying that gold and silver are coming back.
The other thing I want to point out is that it is entirely within the realm of possibility to see a countertrend move within the overall downtrend. That would not be surprising at all. What you need to keep in mind however is that gold and silver have a TON of supply overhead, I have repeated that many many many times because I dont want anyone getting their hopes up, and I dont mean that to put anyone down. Just be aware that it wont be a easy process.
I have seen counter trend moves rip everyones face off, market gets excited, everyone thinks it looks good, and then poof, the rug gets pulled. The other issue worth looking at is,,, whos leading who... is silver going to lead gold lower or is gold going to lead silver higher? I have no idea nor opinion, the market will tell us in due time.
However, by paying close attention to price, we will be able to spot this move higher and we will get plenty of clues whether this move sticks or not.
So there you have it:
1- Gold looks better by silver on a shorter time frame.
2- Both are still in long term downtrends.
3- Silver looks weakest here.
Continue to be patient, allow the element of time to offer clues and always remember that price is king, it doesn't lie and is what will tell us whos doing what.








 First Page
 Previous Page


 Posted 02/02/2014 2:08 pm


