Ok time to update this.
2015 was a year to forget as many assets were locked in a range bound market, going nowhere. Others continued and remain in their respective downtrends,such as commodities. Gold and silver were no different in this aspect.
Before I get into this update, let me again repeat myself on several things I hold to be true and regarding the use of charts.
1- I am a trend following trader. I have a longer time frame than a few days or weeks. I am interested in the bigger picture and time frame.
2- Charts do NOT tell us the future. They are only a record of where
PRICE has been at. They do not tell us where we are going, they do not tell the future.
3- I do not care about the "how" or "why". All that information is irrelevant to me. Those things will be found out or come to light later on and they usually happen AFTER the important move in price has started.
4- I follow a very simple process. I buy either yearly highs or break of trend lines in price OR sell short break of trend lines or yearly lows.
5- I will be WRONG on my opinions. I will be WRONG often more than right even when following my process. Why? Because there is always a level of uncertainty in markets and the best I can do is work off patterns in price I know and that fit my method.
6- Managing RISK is more important than being right to me.
7- Markets and trading are about trying to line up as many probabilities on ones side and then having an exit point in case things do not work out or exacting profits at a certain point.
Now that we have those things out of the way, let us get into the first charts of 2016. As many of you know, I prefer to keep my charts super clean. I like LESS on them and to keep things simple.
When I last looked at some charts and posted them was in October 2015. First we will look at where silver stands now.
You might recall that last year we had a few promising breaks in upward price action where gold and silver appeared to be moving higher and holding their moves. This lasted for a few weeks and then in November of last year, silver and gold went straight down for several weeks.
Within this plunge in prices, silver and gold hit and made fresh yearly lows, also commonly known as 52 lows. From there tho, instead of continuing to push lower, silver and gold began a nauseating pattern of coming close to yearly lows and bouncing, remaining choppy and going sideways. The years lows for silver stand at 13.62 and that occurred on 12/14/15.
Since then we have watched silver chop around in a range. Let us look at this together in the chart below.
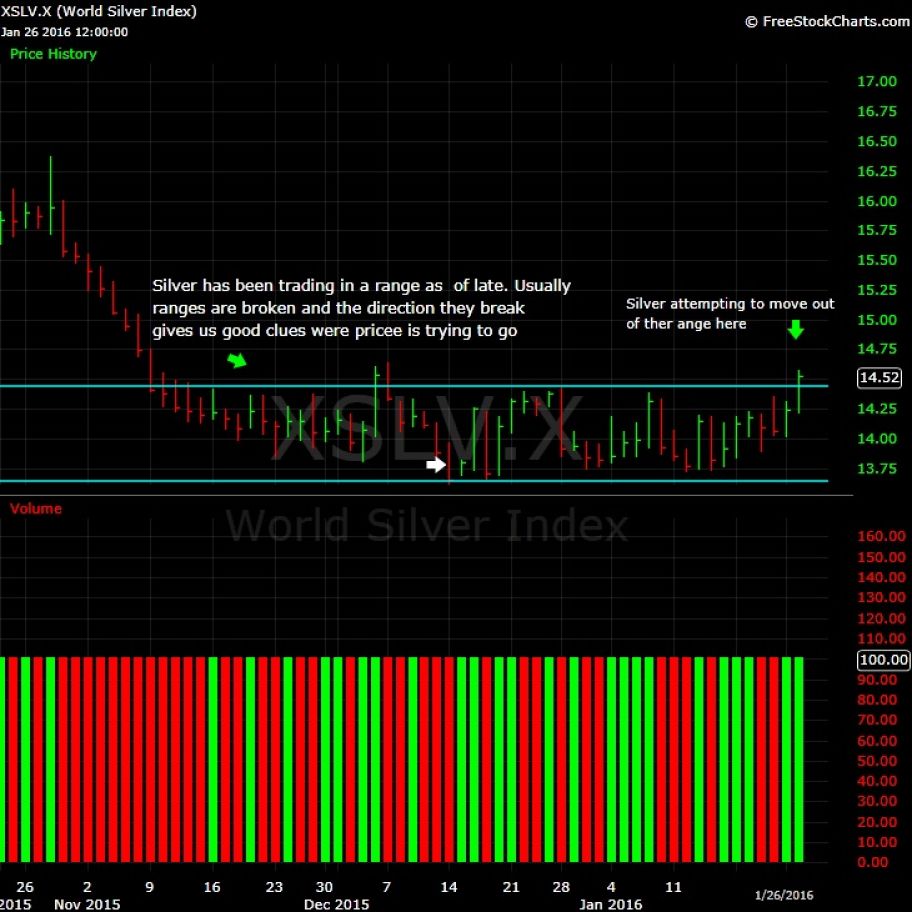
Please look at first the white arrow. That is the yearly low for silver, 13.62 which happened on 12/14/15. That is an important point as that makes the low of the year, if that area gets breached, in time, lower prices are an increased probability.
Notice tho, the range we have as marked by the two aqua lines. This range has been ongoing since mid November of last year and if we look at how silver closed today, it appears to be moving OUT of this range, upward. In shorter time frames, this is the start of a break out to the upside by silver.
How far we go, that is up to the market. Sometimes bigger important moves start with little baby steps. There is going to be plenty of overhead supply, expressed by price, not physical silver, that will hold back how far this this moves. That should be expected.
The coming weeks will tell us more. So keep an eye how silver progresses from here, we are seeing again, a break out happening to the upside. Now time is needed to see how far it goes and whether this is the start of something bigger.
Remember, we have seen PLENTY of moves like this, a counter trend move, which then later fizzles out and we later see silver retesting yearly lows. So again, temper the break out with some skepticism. Allow price to confirm everything along with the element of time.
Now lets look at gold.
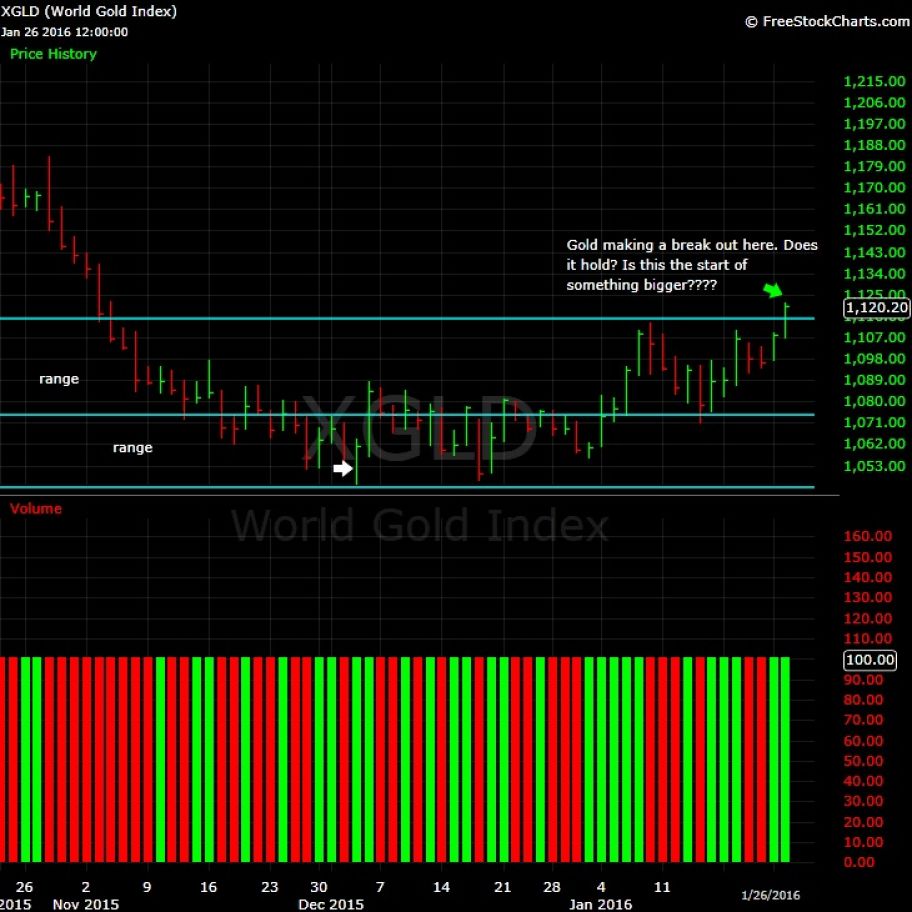
Pretty much the same price action. Two very definable ranges. Notice the white arrow, which is the yearly low for gold, hit on 12/3/15 which was 1045. Since then, gold has been trying to move higher and today saw it break, again, on a shorter time frame, out of its range.
Everything we said about silver applies to gold. There will be plenty of overhead supply to begin with. Therefore, more time is needed to see if this move holds. As the days and weeks go by, we will get more clues as to whether this move holds up and if gold can build on it.
So the key points from this update are-
1- We have a break out, in a shorter time frame, for gold and silver.
2- As always, more time is needed to see if this holds.
3- There will be and it should be expected, some sort of selling. This is not to say buyers cannot push this up but it will take a lot of buying to push from here.
4- We have seen countless times gold and silver break out and then fizzle out.
5- The element of TIME will allow us to see how far and how strong the buying/selling is.
As always keep an open mind and expect the unexpected. I will be following closely here to see if anything actionable shows up... and of course,, I want to see some resolution so that I can get back to adding coins to my somalian elephant collection lol. However, that will depend on Mr Market,,, maybe we see something happen in 2016.








 First Page
 Previous Page


 Posted 01/16/2016 12:50 am


 They crave for it like all other addicts.


