| Author |
 Replies: 114 / Views: 16,290 Replies: 114 / Views: 16,290 |
|
Pillar of the Community
United States
586 Posts |
Silver weekly chart shows spot could be heading to $12 or less, next year. 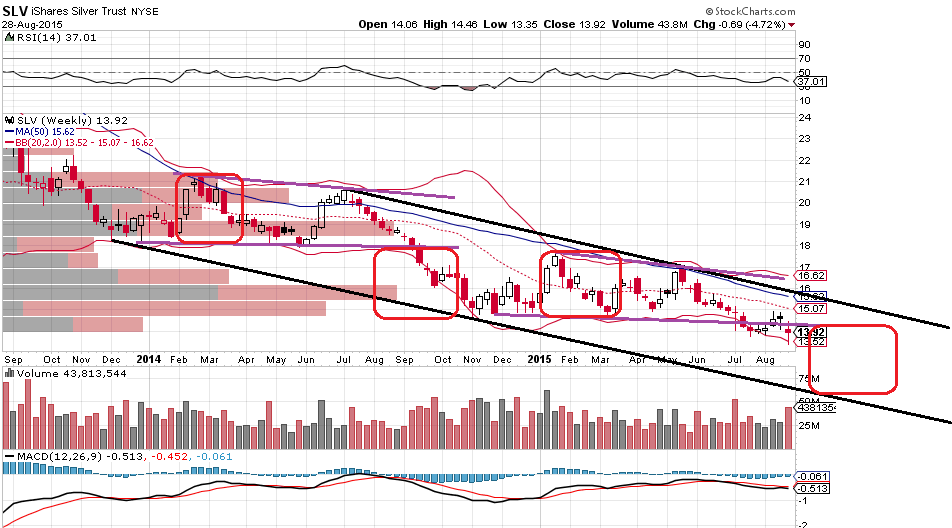  |
|
|
|
Pillar of the Community
 United States
586 Posts |
Based on this chart, I am NOT going to buy any silver unless I see US$13. You probably don't want to wait until 12, since the premium would be sky high at that moment.
However, if you could find any deal close or under spot; then go for it. The movement of premium is more dominant than silver spot change now.
|
|
Pillar of the Community
United States
4085 Posts |
The only thing I will say about those charts is that there is no guarantee that the trend down will continue. At one point in time, there was a trend line up (when silver was going for 20x face or more) and that broke down at some point too.
Silver and gold prices are affected by at least two major market forces. One, they are commodities used in industry. When the economy slows or stutters (for example, China), demand drops and that drives the price down.
Two, they are a store of value in uncertain times. When uncertainty rises, so do precious metals.
Right now, we have some economic slowdown along with market uncertainty that goes with it, so it seems like these forces are opposing each other somewhat. But, as Yogi Berra said, predictions are hard, especially when they are about the future.
|
|
Valued Member
260 Posts |
Silver can be really fun to deal with, or frustrating! Like when I paid $390 for 20 silver eagles, it's been frustrating to try and sell them (I've sold 2).
|
|
Valued Member
260 Posts |
|
|
Valued Member
United States
274 Posts |
I see the downward trend and the bold black lines showing some boundaries of silver's historical price action, but I don't understand the rest of the lines and boxes on the chart. For the uneducated (me), it looks like some kind of magic math that looks for some indicators where there are none. If it was as simple as following a chart, exclusive of considering factors in the world around us, wouldn't it be so easy that everyone would know where the price is heading? I'm not saying it won't go to 12, but why not 10 or 8 or only 13? I'm not seeing how this chart shows with such certainty that 12 is the bottom.
I agree with statement about the premiums. It seems that the premiums take a while after every drop before they contract.
|
|
Pillar of the Community
 United States
4592 Posts |
Right in one, Lunch Money.
Charting - astrological or market - is a belief (not founded on facts) that you can predict future performance based on the extrapolation of data from the chart. Go back another month or start forward a month and all the nice lines have different slopes.
-----Burton 50+ year / Life / Emeritus ANA member (joined 12/1/1973) Life member: Numismatics International, CONECA Member: TNA, FtWCC, NETCC, EveryCountry (online) coin club Owned by three cats and a wife of 40+ years (joined 1983) Author: 3rd Edition of the Sample Slabs book, https://www.sampleslabs.info/ |
|
Pillar of the Community
United States
586 Posts |
@ Lunch Money,
You understand the black lines; that's a good start. I would go ahead and explain other lines and boxes.
Purpose lines: they're called wedge formation; and they're used together with red boxes.
The red boxes are indicative of a measured movement; when a wedge breakdown is confirmed and where price is heading to.
|
|
Valued Member
United States
274 Posts |
To BStrauss3's point, do you have a chart from 3 or 6 months ago that shows we would be where we are today? That would add validity to the accuracy of the price predictions.
|
|
Pillar of the Community
United States
7390 Posts |
I buy to hold not for a quick flip so where it's at now is fine for me to buy personally, if it goes down I'll just buy more.
|
|
Pillar of the Community
United States
1132 Posts |
I'm with Cascade on this. I started buying when it dropped below $20. I'm not sad or dishearted that we're now in the $15 range. I'm just buying 25% more than I was when spot was in in the $20 range. If it drops to $8, even better.
PM's aren't built for quick flips. If you're looking to make a quick buck with your portfolio, you should be looking @ tech titans like Apple or Facebook. If you're hedging inflation or saving for a boat when you retire...PM's could be for you.
|
|
Pillar of the Community
United States
7390 Posts |
Quote:
or saving for a boat when you retire Don't you mean BOATS with an S as in... Break Out Another Thousand... Silvereagles  |
|
Pillar of the Community
United States
5832 Posts |
It could happen going down to $12 or less? Then the premium can go higher.
It can also trade side ways for a while, and then slowly goes back up to $16-18. Then the premium goes even higher.
|
|
Moderator
 United States
16679 Posts |
That's fine. I'll just buy more.
swcoin.ecrater.com
|
|
Pillar of the Community
United States
586 Posts |
@macmercury,
Silver's downtrend has been very strong; with heavy volume traded right above the overhead resistance. It will take heck a lot of efforts to break above the upper Black line; and before that happen, I am just going to wait and see.
|
|
Pillar of the Community
United States
586 Posts |
One more thing to notice,
MA20 and MA50 are both firmly trending downwards; they're moving averages and, before they even turn flat, any bet for a trend reversal is just unrealistic.
|
| |
Replies: 114 / Views: 16,290 |


