| Author |
 Replies: 72 / Views: 10,998 Replies: 72 / Views: 10,998 |
|
|
|
Pillar of the Community
 United States
721 Posts |
|
|
Pillar of the Community
United States
594 Posts |
Quote:
Here's the 2009 breakdown:
2009 P4 -3.05
2009 D4 -2.63
I had a feeling about these and bought rolls from the Mint as soon as they were available. |
|
Pillar of the Community
United States
721 Posts |
|
|
Pillar of the Community
United States
721 Posts |
If you have been following my other threads, I have been also showing a graph of how these z-values correspond to price. I've done this with the LWC as well. The graph shows the log (price) of G4 off of numismedia.com on the y-axis vs. the z-value on the x-axis. You can see a general trend of prices with rarity. I'm getting very similar results with my other studies as well. 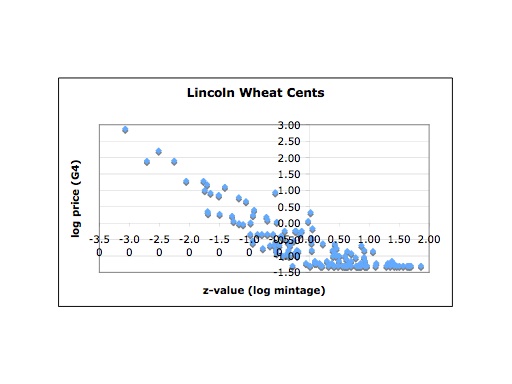 |
|
Pillar of the Community
United States
1231 Posts |
Can someone explain this in simple terms, cause I'm lost as hell
|
|
Pillar of the Community
United States
721 Posts |
Sorry, I'll try. On the graph, you find that the lower mintage coins are found on the left, higher mintage coins are found on the right. Higher priced coins are found towards the top, lower priced coins are found on the bottom. What I find is that a premium in price doesn't start until you get to a certain mintage. I was also trying to use what are established as "key" and "semi-key" coins in the Wheat series in order to predict what should be "key" and "semi-key" coins in the Memorial cent series. Better than trying to predict future prices in my crystal ball. lol |
|
Pillar of the Community
United States
4897 Posts |
DRDAVE- this is very cool! How difficult would it be for you to add the Satin finish coins from the 2005-2010 Mint sets?
|
|
Pillar of the Community
United States
721 Posts |
amida17, I could do it if I have the mintages, but I think it would be pretty meaningless. Like comparing apples and oranges. To make sense of the data, it should be normal circulating coins. You could do a separate analysis for the ones you mention, but the data set would be pretty small, and any statistical conclusion would be suspect.
|
|
Pillar of the Community
United States
4897 Posts |
Ok.. That does make sense. So to include poofs and known mintage varieties would skew the data because one of the rules for your sets are that they are circulating coins? Forgive me it has been twenty years since I took statistics...lol
|
|
Rest in Peace
United States
9104 Posts |
If anything, I would think proof would be added to the circulation figures as another grade.
|
|
Pillar of the Community
United States
927 Posts |
I am new to this forum, so please humor me. I love statistics, but I must admit that I don't understand what the Z values really mean for Lincoln Memorial cents. I mean, really none of these are rare and probably never will be. The regular mintages, anyway (not the double dies, etc.). Are you trying to say that comparatively speaking to the most common dates (highest mintages) that the ones with the lowest Z values are the best buys, or the ones that should be saved? But does it really mean that they will be worth much more than a common date?
|
|
Rest in Peace
United States
9104 Posts |
I would say "these are the coins most likely to have value in the future". The OP may be along to explain things differently.
|
|
Pillar of the Community
United States
721 Posts |
perfessor: when roll searching, the population of some modern coins is still very low despite high mintages. Think about this:
During the years 1909-1958, the total number of wheat cents minted for general circulation is 25,817,170,757. That's 25.8 billion coins total. The mintage of a 1909 S VDB is 484,000. In terms of population statistics, that is 1 out of every 53,000 coins from wheats would be a 1909 S VDB. (That is, if everyone through them back into the population pool, lol.)
During the years 1959-2010, the total number of modern cents minted for general circulation is 433,838,318,390. That's 433.8 billion coins total. (In 1982 alone there were 10.7 billion coins minted, which is almost half of all wheat cents!). The mintage of a 1968-S is 258,270,001 (258 million). Out of the modern cents, 1 out of every 1,680 modern cents is a 1968-S.
Now, from simple population studies, the 1909-S VDB is more rare (even in 1959) than a 1968-S is. Stating the obvious? However, let's pretend that the wheats were never minted, and the starting year for the Lincoln cents was 1959. Which coin is the rarest? 1968-S, of course, you can tell this from simply looking at the mintage numbers. What I was trying to do is to determine if whether certain coins from the modern era should/could be termed "key" or "semi-key" in terms of their relative population. I believe it's not obvious when looking at mintage numbers directly, that's why I've manipulated the numbers the way I have.
So, I guess, the lowest Z-values would be the ones to keep, but you could have done this yourself by looking at the mintage production numbers. My top 10 is no different than anyone else's since they are based strictly off of mintage numbers. What I haven't seen before (and maybe I'm just not aware of it) is a LINEAR TREND of a population statistic with price and I believe I have found it. My next step is to determine what coins are under-priced and over-priced under this analysis scheme, and have a sort of buying strategy. I'm working on that now and still want to do some more studies, but hopefully I'll post those results in another thread soon.
|
|
Rest in Peace
United States
9104 Posts |
The biggest problem with statistics is GIGO. Pricing "should" follow mintage figures, but if the person is using raw data, and isn't aware that people stashed 31s cents, 55s cents and 50d nickels, prices on those issues won't match the data.
If the svdb cent came out later in the year instead of first, the squirrel effect would have worked against it instead of for it, and you prolly couldn't touch one today for under $5000. If you doubt this, price 83wc and 83nc nickels, then compare mintages, which are the opposite of what you'd expect from the prices.
|
|
Pillar of the Community
United States
721 Posts |
Good point biggfredd. I'll be the first to agree with you that mintage statistics aren't the only way to look at prices, but it is one way, and only one tool. There is an overall trend with mintage and prices, however. There are, of course, other factors, some may be more important than mintage figures. That's what makes this hobby so interesting.
|
| |
Replies: 72 / Views: 10,998 |


