Coin Community Family of Web Sites Join Thousands of Coin, Bullion, & Money Collectors
Coin, Banknote and Medal Collectors's Online Mall Join Thousands of Coin, Bullion, & Money Collectors Specializing in Modern Numismatics Shop for APMEX Bullion on eBay!Royal Canadian Mint products, Canadian, Polish, American, and world coins and banknotes. 300,000 items to help build your collection! Vancouvers #1 Coin and Paper Money Dealer


Username:
Password:
Save Password
Forgot your Password?


This page may contain links that result in small commissions to keep this free site up and running.

Welcome Guest! Registering and/or logging in will remove the anchor (bottom) ads. It's Free!

Statistical Analysis Of Key And Semi-Key Indian Head Cents

To participate in the forum you must log in or register.
Author Previous TopicReplies: 0 / Views: 4,568Next Topic  
Pillar of the Community
drdave's Avatar
United States
721 Posts
 Posted 05/21/2011  3:01 pm Show Profile   Bookmark this topic Add drdave to your friends list Get a Link to this Message Number of Subscribers
For background information, I posted a similar thread on Lincoln Cents:

https://goccf.com/t/88992#735292

Now for the Indian Head cents. I thought I would treat these as a single group, and also compare my findings with the current price (as found on numismedia.com for G4.)

For the Indian Head cents, there has been 3 key dates: 1877, 1909-S, and 1908-S. I get good comparable values with the LWC study: key date z-values of -2.2 and less; semi-keys between -2.2 and -1.5.

To get a z-value, I determine the relative standard deviation from the mean (log mintage) values. The results for the "top 10" IHC are as follows:

1909-S -3.49 key
1877 -2.66 key
1908-S -2.44 key
1871 -1.40
1872 -1.38
1870 -1.16
1878 -1.08
1869 -0.99
1876 -0.82
1866 -0.69

Notice there is a large gap between the 3 key dates and the nearest others. I think most people would consider the 1871 and 1872 as semi-key dates, however.

Since the IHC have LONG been out of circulation, I thought it would be interesting to compare these z-values with a current price. Since I am looking strictly at mintage values, I thought that the price for a G4 would be most indicative for comparison purposes. That way, we don't get into other issues like which are more difficult to find in higher grades. The graph below shows the x-axis as the z-values above, while the y-axis shows the log of the price (from numismedia.com).

Statistical-Analysis-Of-Key-And-Semi-Key-Indian-Head-Cents

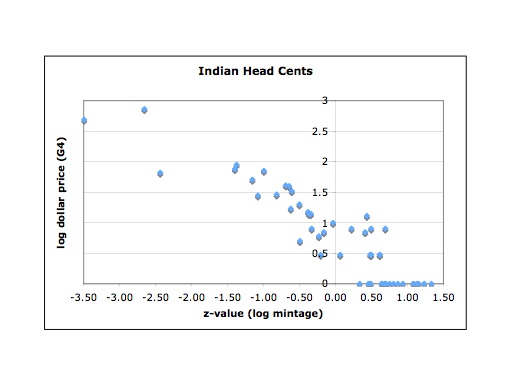
You can clearly see the 3 key dates as being the higher priced ones with large negative z-values. There is definitely a trend with current prices and you can also see the more common dates (positive z-values) having low prices. It also seems that you need a z-value of less than about -0.5 to see any appreciable premium.

Comments? Thanks for reading...
  Previous TopicReplies: 0 / Views: 4,568Next Topic  

To participate in the forum you must log in or register.


Disclaimer: While a tremendous amount of effort goes into ensuring the accuracy of the information contained in this site, Coin Community assumes no liability for errors. Copyright 2005 - 2026 Coin Community Family- all rights reserved worldwide. Use of any images or content on this website without prior written permission of Coin Community or the original lender is strictly prohibited.
Contact Us  |  Advertise Here  |  Privacy Policy / Terms of Use

Coin Community Forum © 2005 - 2026 Coin Community Forums
It took 0.2 seconds to rattle this change. Forums