| Author |
 Replies: 10 / Views: 1,793 Replies: 10 / Views: 1,793 |
|
|
Pillar of the Community
United States
721 Posts |
For background information, I posted a similar thread on Lincoln Cents: https://goccf.com/t/88992#735292Now for the Walking Liberty halves. I thought I would treat these as a single group, and also compare my findings with the current price (as found on numismedia.com for G4.) From the LWC study: key date z-values were found to be -2.2 and less; semi-keys between -2.2 and -1.5. To get a z-value, I determine the relative standard deviation from the mean (log mintage) values. The results for the "top 10" Walkers are as follows. My labels for key and semi-key are from the above definitions: 1921-D -2.43 key 1921 -2.29 key 1938-D -1.71 semi-key 1916-S -1.69 semi-key 1921-S -1.62 semi-key 1916 -1.54 semi-key 1917-D (Obv.) -1.35 1917-S (Obv.) -1.17 1919 -1.16 1929-D -1.12 I then compared the price (G4 based on numismedia.com) with these z-values. The graph below shows the log (price) on the y-axis and z-value on the x-axis. You can see a trend and you can also see a premium for z-values of -1 and less. 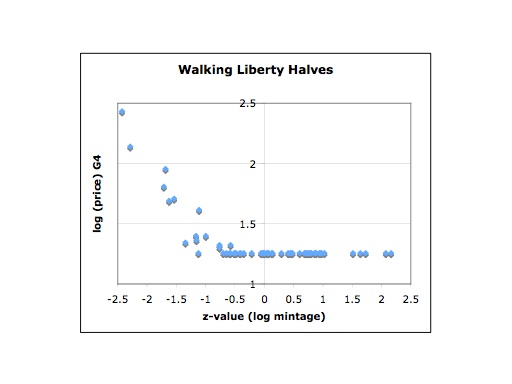 If you look at my similar studies of IHC and Mercury dimes, you see I'm getting very similar results. Comments? Thanks for reading... |
|
|
|
Pillar of the Community
United States
817 Posts |
I don't see how the coins are placed on the grid or how to make sense of it.
|
|
Pillar of the Community
United States
7192 Posts |
I also cannot seen to be able to decipher your grid. Also not listed is the 1916 d, is this based on mintage only? It seems to be the 11th in lowest mintage but it carries a premium on some of the others listed in your top 10.
|
|
Pillar of the Community
 United States
721 Posts |
I give more explanation within this thread: https://goccf.com/t/88992#735292Also, the 1916-D would be at number 11. I didn't want to list them all  My 10 listed are the 10 lowest mintage numbers. Basically, what is plotted is a log of the price vs the log of the mintage. Low mintage coins (to the left of the graph) have higher prices (to the top of the graph). Nothing unusual here. But what I did find is a fairly linear trend of price and mintage (on a log scale) below a certain mintage. |
|
Pillar of the Community
United States
4416 Posts |
Interesting chart, but it's not easy for the average guy, like me, to interpret. I do get a sense that there are no particularly rare dates in the series; something that experience has long led me to believe.
The 1938-D's are, IMHO, way over-priced. At the FUN Show, one dealer I know had 14, yes fourteen, ROLLS of them! The early dates, pre-1934, in mid to high grades are genuinely scarce. Such coins are typically over-graded by sellers.
|
|
Pillar of the Community
United States
817 Posts |
Which blue dot represents which coin and how is it's position determined?
|
|
Valued Member
United States
273 Posts |
The graph would benefit from a price scale (instead of an arbitrary number) on the Y-axis and have the dots show which coins they represent. This is actually quite neat data to show which coins may be the best value. A low z-score with a low price could be construed as a better value for money than a high z-score coin with the same price.
This would be very cool to do with the Commemorative series for which 'Distribution' numbers exist (take into account coins that were melted).
Anyways, this is definitely cool analysis. I'd like to see it developed more.
|
|
Pillar of the Community
United States
721 Posts |
Quote:
The graph would benefit from a price scale (instead of an arbitrary number) on the Y-axis and have the dots show which coins they represent. canadanz - the y-axis is not arbitrary. It is the logarithm of the price. For example, if the price is $100, the log(100) = 2.0 and that is what is plotted. If the price is $50, the log(50) = 1.7. I also can choose to plot the log of the mintage on the x-axis, but for comparison between different series, I find the z-value more useful. And yes, labels would be neat, but too messy. Anyone with access to a spreadsheet, mintage numbers and prices can make their own plot like this. |
|
Bedrock of the Community
United States
20753 Posts |
Afraid I miss the entire purpose of such statistics. Almost any coin's value and key date info is based on popularity, quantity minted, type of coin, the weather, mother's maiden name, where being sold, slabbed, your shoe size, etc. Prior to going to most coin shows I make lists of coins I need or want. Check out prices on ebay, The Red Book, PCGS forum, Numismedia, etc. Then at a coin show I find it was a waste of time since coins are sold on to many variables. Even an attempt at key dates sometime fails dramatically. Take for instance the 1932D Mercury dime. 4th lowest mintage in the series and far from what could could be called a key. Just to many variables in coin values, prices, key ratings, etc. Edited by just carl
06/01/2011 09:36 am
|
|
Pillar of the Community
United States
7192 Posts |
just carl, did you mean a 1931 D Mercury? I don't see any 1932 or 1933 dimes listed as being minted.
|
|
Pillar of the Community
United States
1745 Posts |
drdave, Interesting results, but not surprising to see a correlation between premium and scarcity. What it doesn't account for is those coins which were hoarded and are plentiful today. Or as justcarl states.... mother's maiden name, shoe size, etc. For example: 1943 Cents, 1883 Liberty nickel (no cents), 1913 Buffalo nickels, all the State Quarters, 1964 Kennedy half dollars, and Columbian Half Dollars to name a few. Also as prices increase, say to > $100/coin, the sensitivity to the price increases. For example, if there is a BU Wheat Lincoln I want and it's priced 50% above where I think it should be, I most likely don't care if I pay $3 for a $2 coin. But I would certainly take notice if I was considering paying $150 for a $100 coin. Keep up the good work. |
| |
Replies: 10 / Views: 1,793 |
|


