| Author |
 Replies: 13 / Views: 1,416 Replies: 13 / Views: 1,416 |
|
|
Pillar of the Community
Canada
1081 Posts |
When I first started trying to understand the modern coin grading system I was somewhat thrown by the numbers - I could never tell which mattered more, the numbers or the words? Do the numbers modify the meaning of the words or vice versa? Are the numbers a freestanding scale? In an analytical fit one day, I decided to graph the number of graded coins at each numerical level on PCGS for several difference series of coins. The graph I show below is the Victorian 1c, 5c, 10c and 25c. The results are sort of cool. There appear to be 3 almost Gaussian curves centred at ~40, 55 and 63 with discontinuities between EF and AU and then again (especially pronounced) between AU and MS. If the numbers were just a continuous graded scale then this would not be the case. To me this means that the numbers just serve to add an extra layer to the qualitative word scores. There are coins that are agreed to be EF, others that are AU and still others that are MS and, within each category, the distribution is essentially random. This works with every series of coins I've tried incl Canadian, American and beyond. 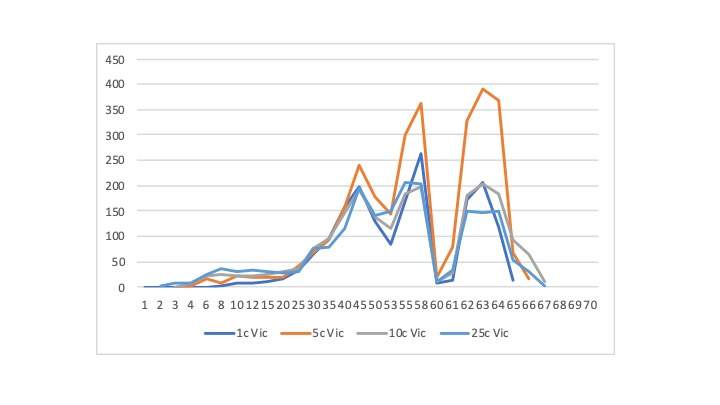 |
|
|
|
Moderator
 United States
191016 Posts |
That is interesting.  |
|
Valued Member
United States
191 Posts |
It's intriguing to see the relatively even curve up to EF45 and then the 2 disruptions going into AU and MS.
|
|
Moderator
United States
191016 Posts |
An AU-58 usually has better eye appeal than an MS-60. Same can be said at the EF/AU boundary I suppose. Not sure if the skew is from grader bias or crack/regrade attempts.
|
|
Pillar of the Community
Canada
5271 Posts |
@Silver101, I see the potential for an interesting article here. Gathering a lot more data will add strength to any hypothesis.
Essentially there are no MS-60 coins, and why is that? Here is an hypothesis:
Coins leave (or left) the mint) at about an MS-63 or 64. To get to MS-60 requires a lot of time in a bag getting bag marks, etc. More typically coins spend little time in the bag and then hit circulation. At that point they then immediately drop to at least AU-59 without passing through the states 60-62. Kind of like a quantum jump.
The explanation for the circulated grade gaps requires a different explanation.
|
|
Pillar of the Community
 Canada
1081 Posts |
It's fascinating eh? There are many dealers who split hairs with grades like AVF, VF-35 and AEF. It's just funny that if you count up from AU53 through MS 63 you hit that astoundingly deep trough. It says that 60 is very very different from 59. And that, to me is all about the words "***about*** uncirculated" and "***mint*** state". The even funnier thing about it is that in my experience most coins graded MS61 or 61 are less appealing than the AU58s. If you're used to working with numbers is makes no sense. On the other hand, if you're used to working with people it makes perfect sense!
Furthermore, there's an absolute ton of data on this and, honestly, the peaks shift around a little (e.g. MS63 to 64) but the curve shapes are the same for any Canadian or American coin set. Is this seriously something that someone would write up? Where would it go?
|
|
Pillar of the Community
Canada
5271 Posts |
@Silver101, as an article, I do think that it is worth writing up, possibly the RCNA journal. Of course, not being an editor it is just my opinion, but the subject matter seems more interesting than many of the articles in that journal. The complete explanation does, I think, involve human factors as you have alluded to. |
|
Valued Member
United States
191 Posts |
Yes, I believe it is worthy of an article. I, for one, would find it most educational.
|
|
Pillar of the Community
Canada
1081 Posts |
Hmm - interesting! Though I suspect I've already exhausted the topic! Anyway, I'll think it over...
|
|
Pillar of the Community
 United States
5691 Posts |
Interesting observation. It might also be related to selection bias, i.e. those coins sent to PCGS tend to be better examples of AU and MS grades, and not on the lower end of the grade.
|
|
Valued Member
United States
97 Posts |
I agree. I think you have illustrated in w a very fine manner what goes on in the grading system. I see nothing new here.
What I'd like to confirm is if there are more coins graded at the top of each grade. For example, I'll bet there are more coins graded EF-45 than EF-40 in each coin type. If that turned out to be true, we could discuss the reasons. I don't think the MS-60 grade has existed for a very long time. That explains the dip in the chart.
|
|
New Member
United States
4 Posts |
Good Stuff! I'm also a soul with an interest in charting and graphical analysis. So, I find this chart to be very interesting. Like many presentations, this does not readily explain the "why." However, it opens up many possible theories. It takes in all the various reasons a coin might be submitted.
It is still only a sample of coins submitted to one particular grading service. It is not the entire population of coins. Totals from a sample of a population might be a little misleading.
All in all, though, it is pretty cool.
|
|
Pillar of the Community
United States
3345 Posts |
This is super interesting and should def be written up! Go for it! And maybe graphing a few other random coin types might help you build a hypothesis as to why these things happen.
|
|
Pillar of the Community
Russian Federation
5181 Posts |
It might be interesting to do similar graphs for less common coins (not sure which type would work best), where even the lower grades (VF, F, VG...) are sufficiently often valuable enough to be slabbed, and are thus better represented in the stats. Would there be F/VF and VF/XF discontinuities in those graphs?
The graph for 1909-S VDB cents would be interesting, I guess; IIRC they're well represented through the entire grade range.
|
| |
Replies: 13 / Views: 1,416 |
|


