Coin Community Family of Web Sites Join Thousands of Coin, Bullion, & Money Collectors
Royal Canadian Mint products, Canadian, Polish, American, and world coins and banknotes. Join Thousands of Coin, Bullion, & Money Collectors Royal Estate Auctions - $1 Coin AuctionsVancouvers #1 Coin and Paper Money Dealer 300,000 items to help build your collection! Specializing in Modern Numismatics Coin, Banknote and Medal Collectors's Online Mall


Username:
Password:
Save Password
Forgot your Password?


This page may contain links that result in small commissions to keep this free site up and running.

Welcome Guest! Registering and/or logging in will remove the anchor (bottom) ads. It's Free!

1994 10c Coin Mintage Figure

To participate in the forum you must log in or register.
Author Previous TopicReplies: 6 / Views: 2,422Next Topic  
Valued Member

Australia
248 Posts
 Posted 03/01/2016  07:27 am Show Profile   Bookmark this topic Add Hercules to your friends list Get a Link to this Message Number of Subscribers
I've just finished noodling through almost $300' worth of 10c coins, and I'm becoming increasingly convinced that the mintage of the 1994 10c coin was much lower than the mint says it was.

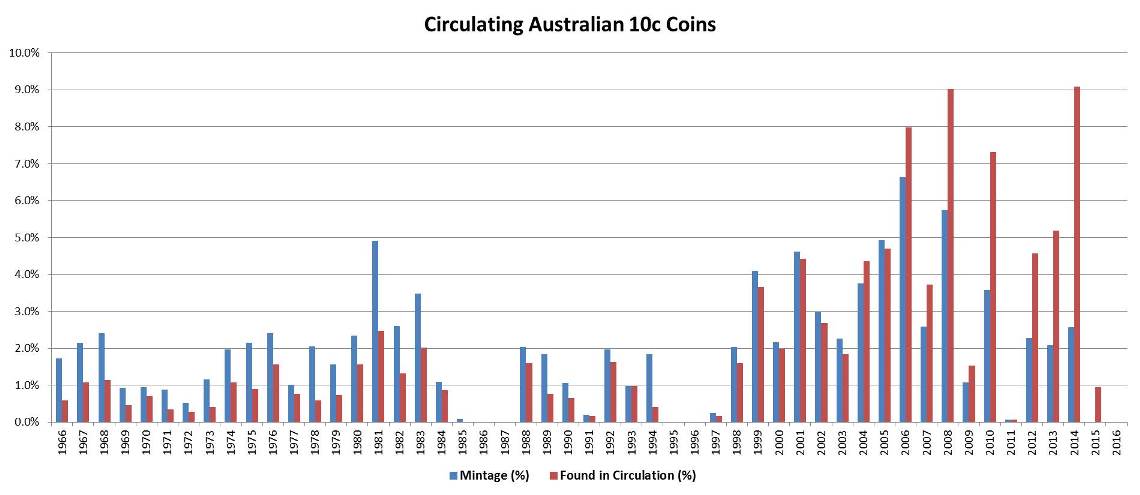
The reported mintage is 43.7 million, but I only find it about 2/5 as often as the 1993 10c, which has a reported mintage of 23.1 million, and about 2/3 as often as the 1990 10c, which has a reported mintage of 25.0 million.

Depending on which figure you believe, the final mintage of this coin seems to be around 10-15 million, not the 43.7 million claimed by the mint.

Has anyone else noticed this discrepancy?

All the other coins minted in the early 1990s have an attrition rate of about 70-85%, but the 1994 10c coin has an attrition rate of 94%, which is higher than every other year except 1985.

Either people are hoarding the 1994 10c coin en masse, or the mint has drastically overestimated how many it actually made.

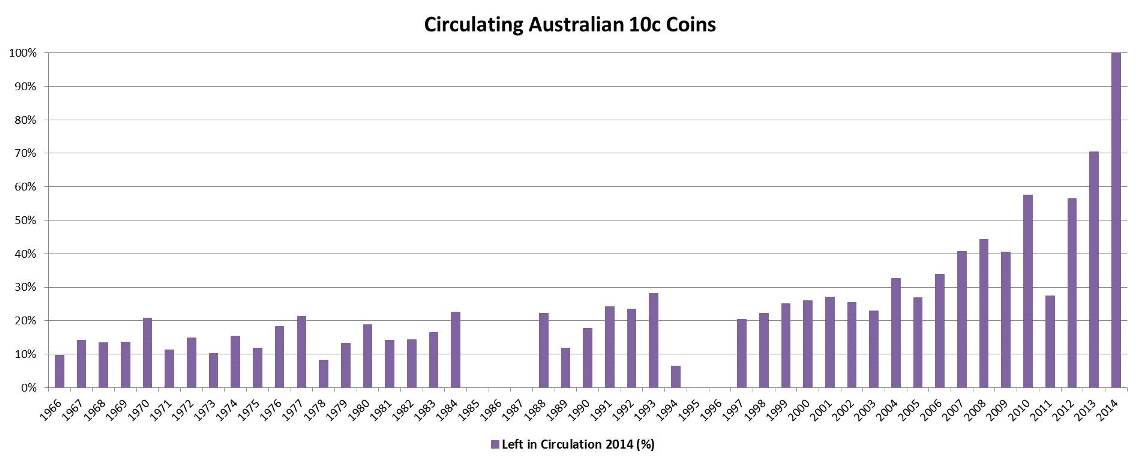
Here's a graph to put this in perspective:

1994-10c-Coin-Mintage-Figure

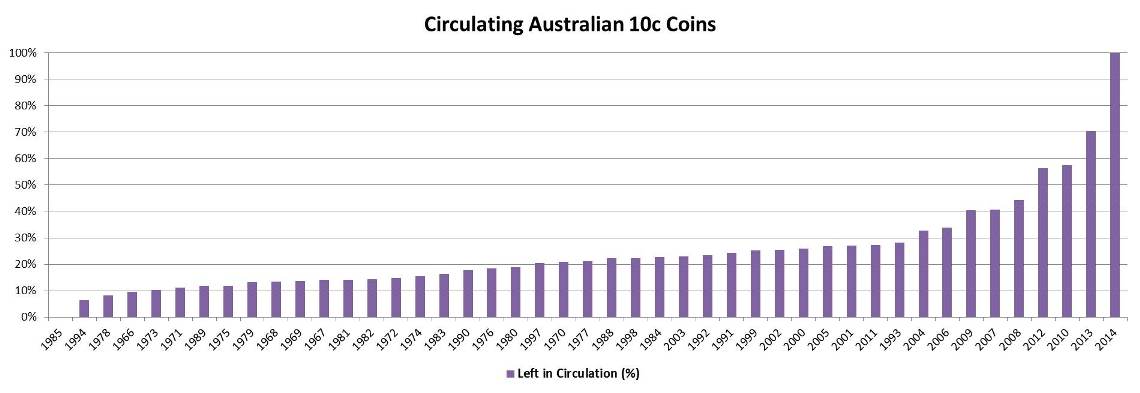
The years on the left-hand side of the graph should be those with very low mintages (which indicates hoarding), or those that were minted a long time ago (which indicates normal wear and tear).

The 1994 10c coin should be in the middle of the graph, near the 1990, 1992 and 1993 releases, not out on the far left edge, near the 1966, 1971 and 1973 releases.

A coin released in 1994 should not have the same attrition rate as those released 20 or 30 years earlier, unless it is very rare, so I cannot see how it's possible for it to have a mintage of more than half of what the mint claims.

Has anyone else noticed that the attrition rate for the 1994 10c coin is almost unbelievably high?

The 1989 figure also looks sus, but not as sus as the 1994 one.
Edited by Hercules
03/01/2016 07:30 am
Moderator
Learn More...
nss-52's Avatar
United States
54282 Posts
 Posted 03/01/2016  07:52 am  Show Profile   Check nss-52's eBay Listings Bookmark this reply Add nss-52 to your friends list Get a Link to this Reply
I have them.... ... I am trying to corner the market.
Show your financial support of the Coin Community Family (click here)
See my topic on Mexican Numismatic Medals (click here)
Pillar of the Community
Biedercoins's Avatar
United States
1602 Posts
 Posted 03/01/2016  08:31 am  Show Profile   Bookmark this reply Add Biedercoins to your friends list Get a Link to this Reply
Are we talking about Australia 10˘ or U.S.? One thought: the number of coins minted do not necessarily equal the number released.

Another thought: do you have detailed actual counts on these coins? If so, you could do some simple stat analyses to find out if these differences are statistically significant.

edit: OK, I see on the graph we're talking about Australia 10˘.

Edited by Biedercoins
03/01/2016 08:39 am
Pillar of the Community
Biedercoins's Avatar
United States
1602 Posts
 Posted 03/01/2016  08:42 am  Show Profile   Bookmark this reply Add Biedercoins to your friends list Get a Link to this Reply
Can you do a graph with # of coins as a function of time?
Valued Member
Australia
248 Posts
 Posted 03/02/2016  08:57 am  Show Profile   Bookmark this reply Add Hercules to your friends list Get a Link to this Reply

Quote:
Can you do a graph with # of coins as a function of time?


I had one in an earlier thread I posted last week, but it's a little out-of-date now, so here's the latest version:

1994-10c-Coin-Mintage-Figure

As you can see, the figure for 1994 looks incredibly low compared to 1993, and this is reflected in the raw statistics:

1994-10c-Coin-Mintage-Figure

Notice just how small the red bar is compared to the blue one for 1994.

So far, I have found only 12 coins dated 1994, compared to 28 dated 1993 and 47 dated 1992, which is not what I'd expect based on the mintages.

I've also found 5 coins dated 1991, and another 5 dated 1997, despite the fact that their individual mintages are supposed to be 7 times lower than the 1994 one.

This is based on a sample size of 2871 coins, so I doubt anything will change if I keep adding to it.


Quote:

the number of coins minted do not necessarily equal the number released


I guess they could have always melted them down like the 1983-1988 20c, but if so, where is the evidence?


Quote:

Another thought: do you have detailed actual counts on these coins? If so, you could do some simple stat analyses to find out if these differences are statistically significant.


That sounds interesting. What kind of statistical analysis would you suggest?


Quote:
Are we talking about Australia 10˘ or U.S.?


I assume that if it's posted in the Australian section of the forum, then it's talking about Australian coins. Likewise for the US section of the forum.

As long as everyone observes this protocol, there should be no confusion.
Pillar of the Community
MobOfRoos's Avatar
Australia
762 Posts
 Posted 03/03/2016  05:28 am  Show Profile   Bookmark this reply Add MobOfRoos to your friends list Get a Link to this Reply

Quote:
One thought: the number of coins minted do not necessarily equal the number released.


The fact that it was a year before 2 "mint set only" years makes me think that it could be the explanation. They may have minted 10 - 15 million and then melted the rest down as they weren't needed, just like they did with the 20c in 1983 and 1984.

Valued Member
Australia
248 Posts
 Posted 03/03/2016  08:21 am  Show Profile   Bookmark this reply Add Hercules to your friends list Get a Link to this Reply
That's what I think as well, but how would you prove it? Are there any records of the mint melting down 10c coins in the mid-1990s?
  Previous TopicReplies: 6 / Views: 2,422Next Topic  

To participate in the forum you must log in or register.


Disclaimer: While a tremendous amount of effort goes into ensuring the accuracy of the information contained in this site, Coin Community assumes no liability for errors. Copyright 2005 - 2026 Coin Community Family- all rights reserved worldwide. Use of any images or content on this website without prior written permission of Coin Community or the original lender is strictly prohibited.
Contact Us  |  Advertise Here  |  Privacy Policy / Terms of Use

Coin Community Forum © 2005 - 2026 Coin Community Forums
It took 0.28 seconds to rattle this change. Forums